There is a cottage industry that has built up for providing new statistics and charts for looking at in granular detail, valuing and predicting prices and changes with Bitcoin. These include:
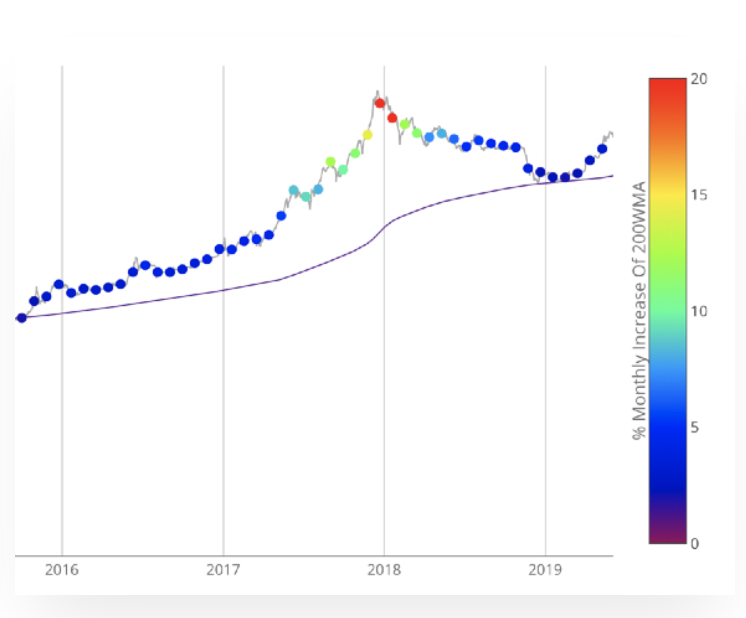
In each of its major market cycles, Bitcoin's price historically bottoms out around the 200 week moving average. This indicator uses a colour heatmap based on the % increases of that 200 week moving average. Depending on the month-by-month % increase of the 200 week moving average, a colour is assigned to the price chart. Long term Bitcoin investors can monitor the monthly colour changes. Historically, when we see orange and red dots assigned to the price chart, this has been a good time to sell Bitcoin as the market overheats. Periods where the price dots are purple and close to the 200 week MA have historically been good times to buy. The 200WMA heatmap can be a useful tool as it shows on a historical basis whether the current price is overextending (red dots) and may need to cool down. It can also show when Bitcoin price may be good value on a historical basis. This can be when the dots on the chart are purple or blue. Over more than ten years, $BTC has spent very little time below the 200 week moving average (200WMA) which is also worth noting when thinking about price predictions for Bitcoin or a Bitcoin price forecast.
This metric looks at the supply side of Bitcoin's economy - bitcoin miners and their revenue. It explores market cycles from a mining revenue perspective. Bitcoin miners are sometimes referred to as compulsory sellers due to their need to cover fixed costs of mining hardware in a market where price is extremely volatile. The revenue they generate can therefore influence price over time. The Puell Multiple is calculated by dividing the daily issuance value of bitcoins (in USD) by the 365-day moving average of daily issuance value.
There are periods of time where the value of bitcoins being mined and entering the ecosystem is too great or too little relative to historical norms. Understanding these periods of time can be beneficial to the strategic Bitcoin investor. The chart above highlights periods where the value of Bitcoin's issued on a daily basis has historically been extremely low (Puell Multiple entering green box), which produced outsized returns for Bitcoin investors who bought Bitcoin here. It also shows periods where the daily issuance value was extremely high (Puell Multiple entering the red box), providing advantageous profit-taking for Bitcoin investors who sold here.
The Puell Multiple uses the upper red band on the chart to show when miner revenues in USD terms are significantly higher than historical norms (in this case the 365-day moving average). Over the majority of Bitcoins’ existence, these periods have been when the price of $BTC has also reached its major highs. So the Puell Multiple can be a useful Bitcoin forecasting tool to identify based on this metric whether price is too high and needs to drop (when the indicator is in the red zone), or whether it is too low and may need to bounce (indicator is in the green zone).
This model treats Bitcoin as being comparable to commodities such as gold, silver or platinum. These are known as 'store of value' commodities because they retain value over long time frames due to their relative scarcity. It is difficult to significantly increase their supply i.e. the process of searching for gold and then mining it is expensive and takes time. Bitcoin is similar because it is also scarce. In fact, it is the first-ever scarce digital object to exist. There are a limited number of coins in existence and it will take a lot of electricity and computing effort to mine the 3 million outstanding coins still to be mined, therefore the supply rate is consistently low.
Stock-to-flow ratios are used to evaluate the current stock of a commodity (total amount currently available) against the flow of new production (amount mined that specific year). For store of value (SoV) commodities like gold, platinum, or silver, a high ratio indicates that they are mostly not consumed in industrial applications. Instead, the majority is stored as a monetary hedge, thus driving up the stock-to-flow ratio. A higher ratio indicates that the commodity is increasingly scarce - and therefore more valuable as a store of value.
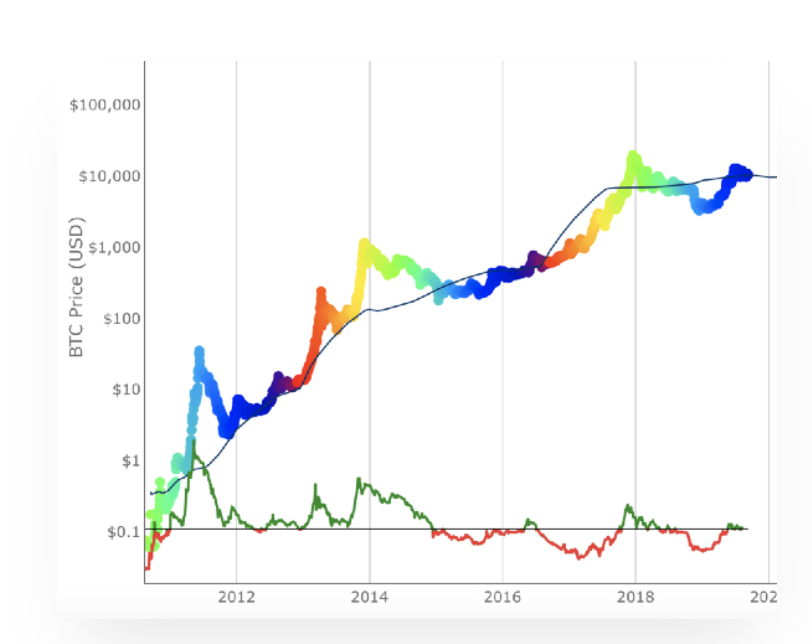
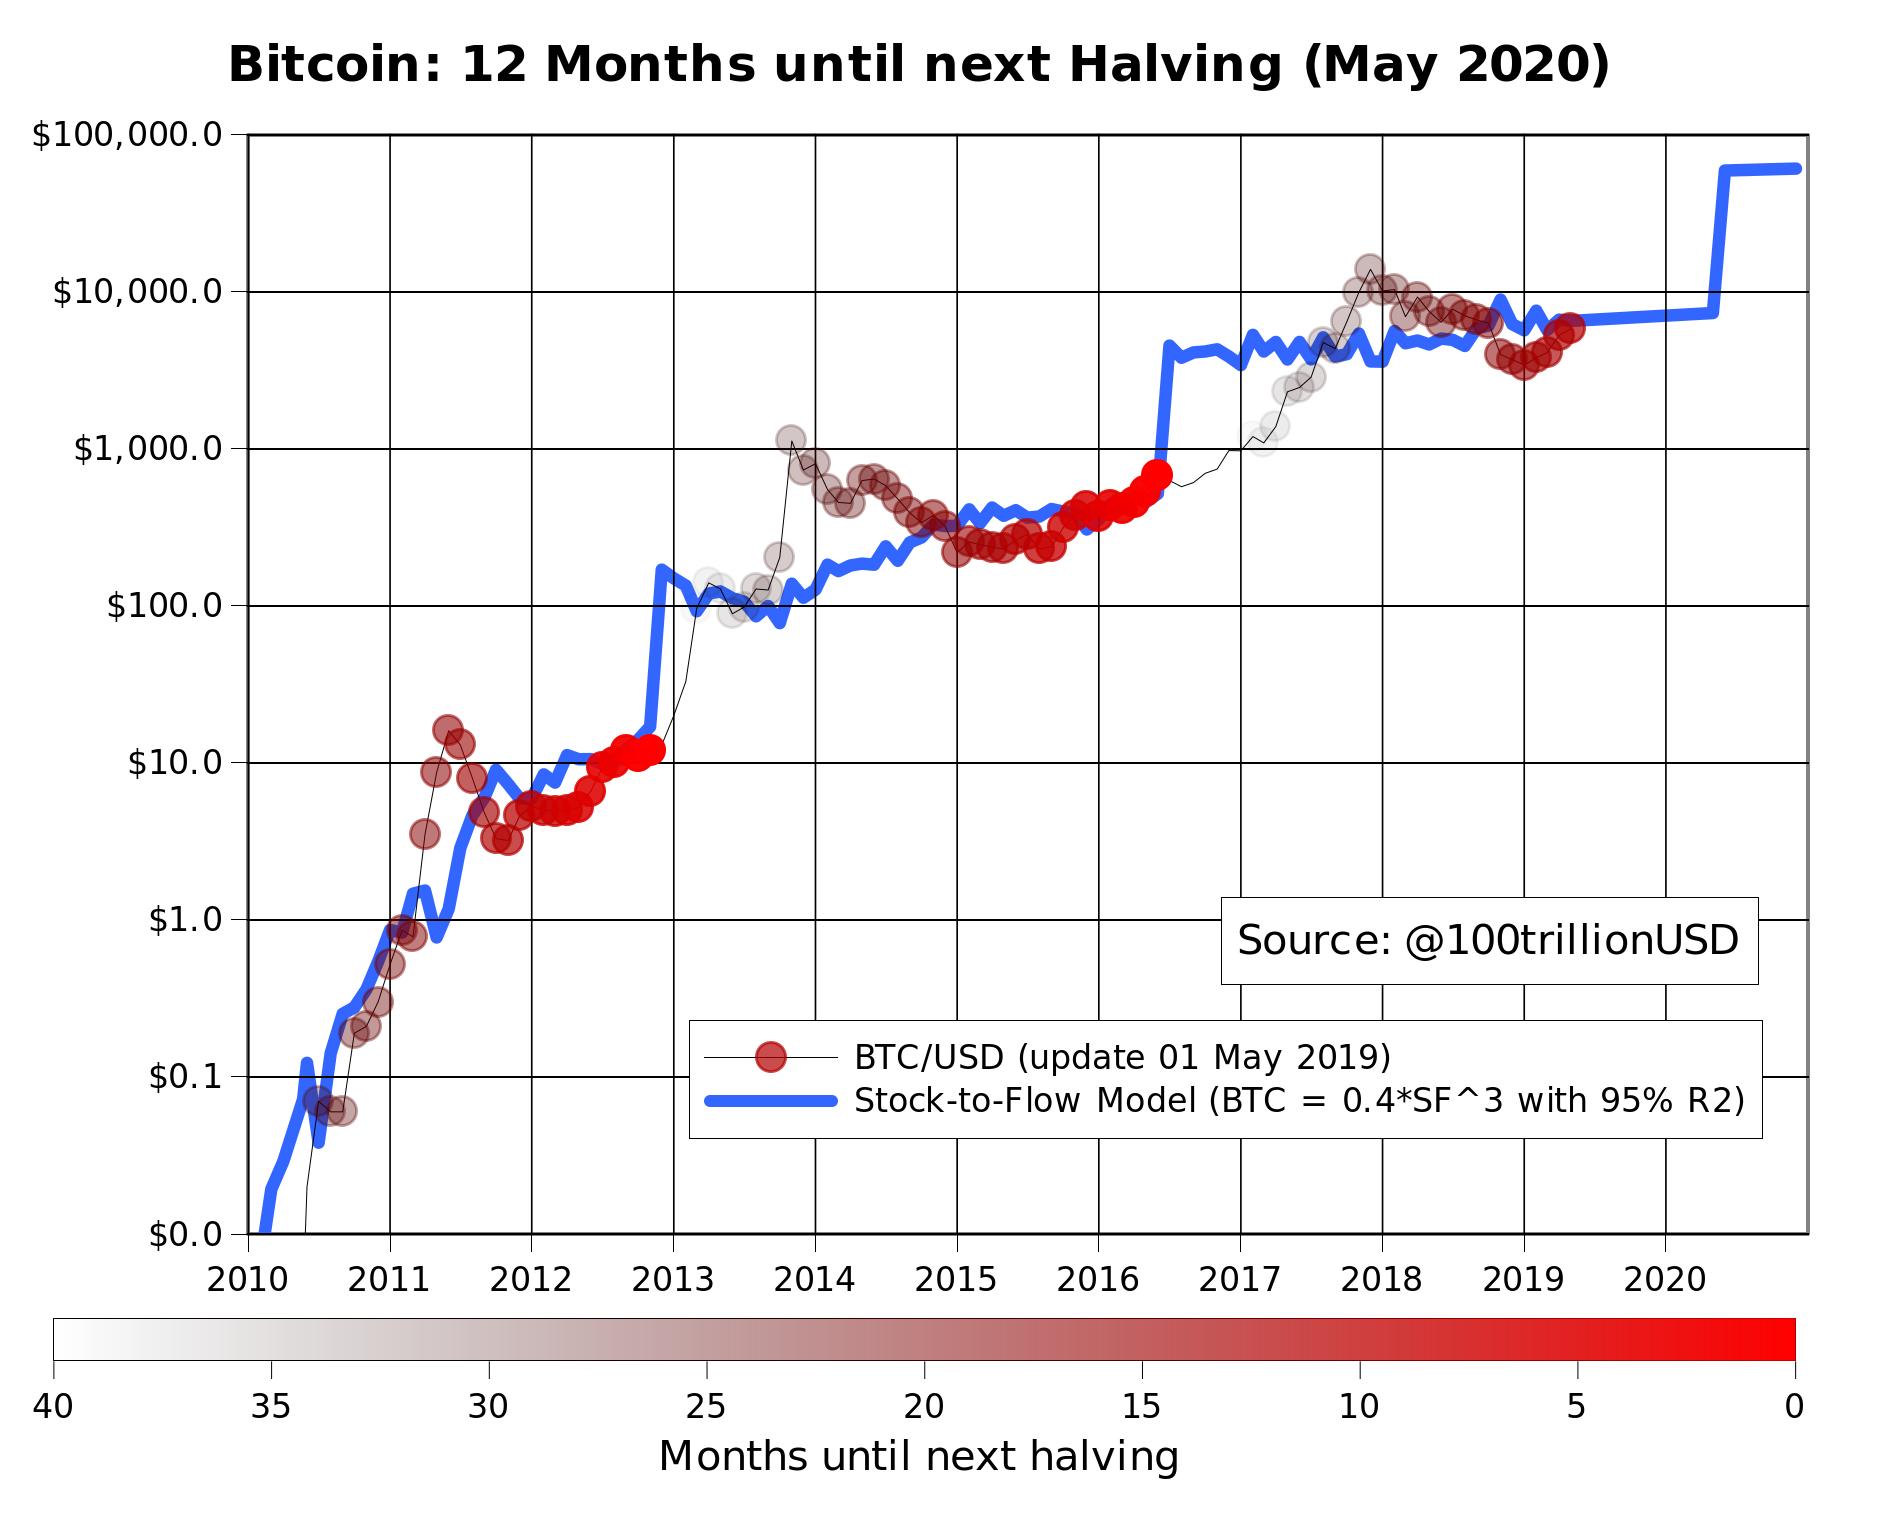
On the Stock-to-Flow Model chart price is overlaid on top of the stock-to-flow ratio line. Price continues to follow the stock-to-flow of Bitcoin over time. The theory, therefore, suggests that we can project where price may go by observing the projected stock-to-flow line, which can be calculated as we know the approximate mining schedule of future Bitcoin mining.
The coloured dots on the price line of this chart show the number of days until the next Bitcoin halving (sometimes called 'halvening') event. This is the event where the reward for mining new blocks is halved, meaning miners receive 50% fewer bitcoins for verifying transactions. Bitcoin halvings are scheduled to occur every 210,000 blocks – roughly every four years – until the maximum supply of 21 million bitcoins has been generated by the network. That makes stock-to-flow ratio (scarcity) higher so in theory price should go up. This has held true previously in Bitcoin's history.
Logarithmic analysis uses historical data to forecast and predict future prices. The Bitcoin Logarithmic growth curve takes all the historical price data of Bitcoin and uses log growth analysis to develop curves that project a potential path of future price growth.
Historically, price tends to bounce between the upper and lower bounds of the logarithmic growth curve. The reason for this is because Bitcoin moves through market cycles.
Further reading: Harold Christopher Burger, Cole Garner and Quantadelic
With traditional investing there are various measures and metrics that are used. These tools can also be used with investing for Bitcoin. These include:
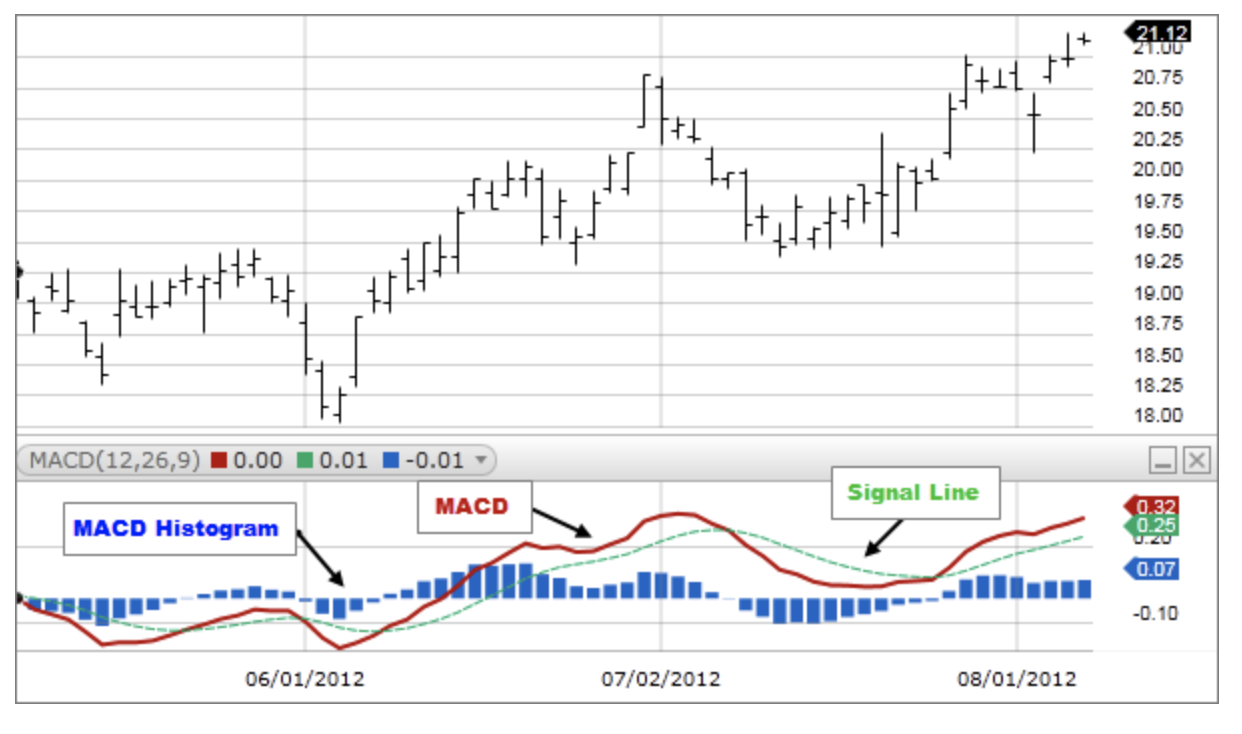
The Moving Average Convergence/Divergence indicator is a momentum oscillator primarily used to trade trends. Although it is an oscillator, it is not typically used to identify overbought or oversold conditions. It appears on the chart as two lines which oscillate without boundaries. The crossover of the two lines give trading signals similar to a two moving average system.
RSI
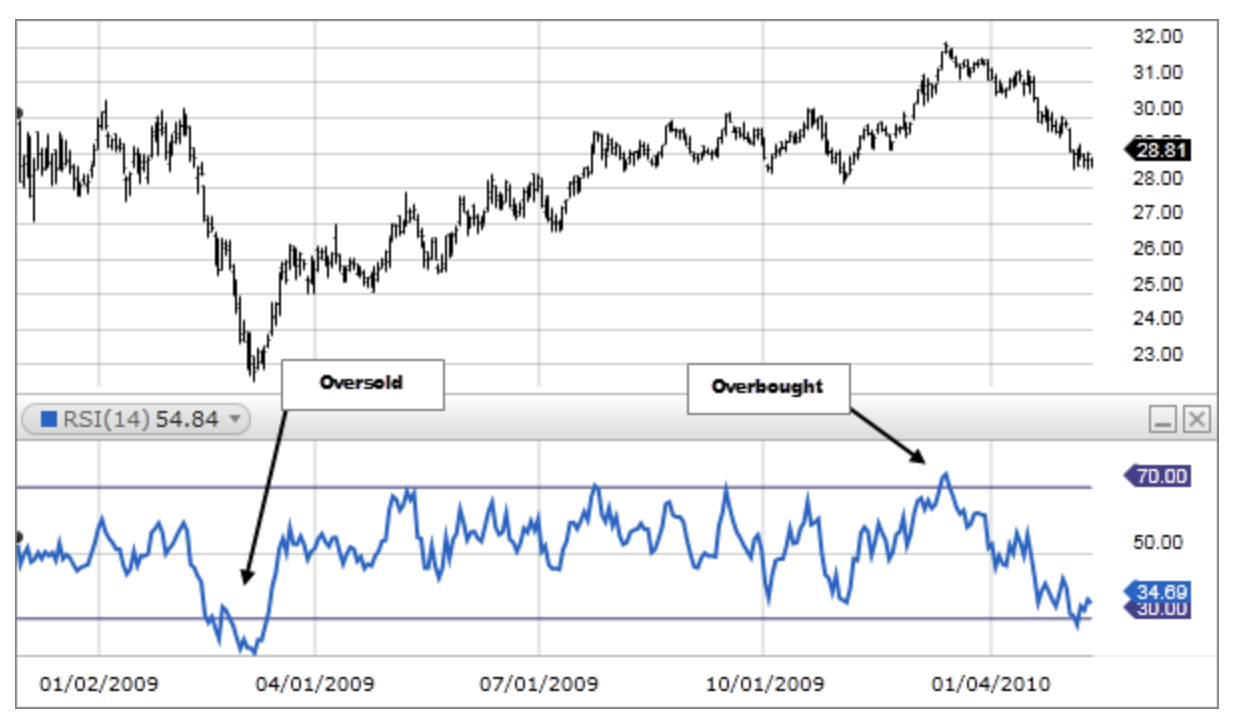
The Relative Strength Index (RSI), is a momentum oscillator that measures the speed and change of price movements. The RSI oscillates between zero and 100. Traditionally the RSI is considered overbought when above 70 and oversold when below 30. Signals can be generated by looking for divergences and failure swings. RSI can also be used to identify the general trend.
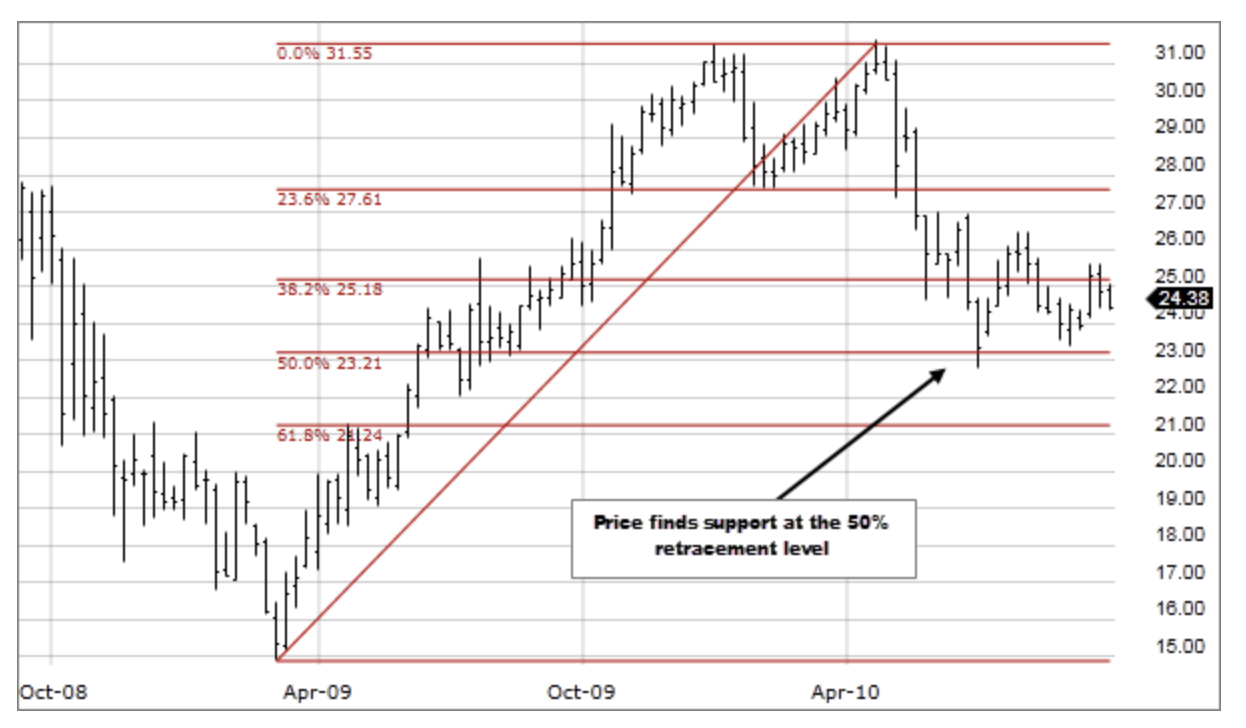
FIBONACCI LEVELS
The Fibonacci retracement tool plots percentage retracement lines based upon the mathematical relationship within the Fibonacci sequence.
Fibonacci numbers are a sequence of numbers in which each successive number is the sum of the two previous numbers: 1, 1, 2, 3, 5, 8, 13, 21, 34, 55, 89, 144, 233, and so on. These retracement levels provide support and resistance levels that can be used to target price objectives.
Fibonacci retracements are displayed by first drawing a trend line between two extreme points. A series of six horizontal lines are drawn intersecting the trend line at the Fibonacci levels of 0.0%, 23.6%, 38.2%, 50%, 61.8%, and 100%.
These reviews will help you to get you started and serve as a signpost for your Bitcoin journey. The reviews are books, exchanges and hardware wallets. These include:
"This book is an excellent introduction to Bitcoin. The book discusses some key facts about Bitcoin and the history of cryptocurrency. There is also a discussion about Satoshi Nakamoto and who he/she/them/it was is or are."
"Reading this book was the first time I learned about cryptocurrency, way back in 2012. From then on I learned about cryptography and encryption which are key themes that run through the book. It’s a very well written book, funny, smart and though provoking. It took me a while to pronounce the book correctly, which is Kry-Pt-O-Nom-i-Kon. I have this book to thank for introducing me to Bitcoin"
For the last few years my Twitter account has had a mantra and slogan as part of the profile. It sums up quite neatly why I am interested in Bitcoin. It also sums up a piece of advice I wish I could tell my self 12 years ago. The slogan is "Buy Bitcoin, you'll thank yourself in the future".
Hello and welcome, this is the new home for the blog BBCD Satoshi. Thank you for looking!
Over the next few months we'll update material and add new pages.
In one form or another, the Blog has been running since 2018. Rather than deleting all the old posts, I've downloaded them all and uploaded them to this blog. You'll see quite a few posts going back over time.
To get a high-level overview of operating systems from a user’s perspective, get the latest “For Dummies” book for the operating system you are using: Linux, macOS, or Windows. If you have the time and inclination, have all three operating systems installed on the same or on different computers to see which you prefer and to access software that is exclusive to that operating system.
Command Line
As a user you could stop here, but if you want to get technical you’ll have to get comfortable with the command line, a text-only interface where your mouse is (usually) useless! The command line interface (CLI) is the opposite of what you’re probably used to interacting with, the graphical user interface (GUI). I know just enough about the CLI to get by, but there are folks out there who are CLI wizards. Windows has a very different CLI from Linux and macOS, so I would recommend installing the Windows Subsystem for Linux (WSL). It will allow you to learn the command line in a way that is generally portable to macOS and Linux.
git is a distributed version control system that is widely used in software development. I think git is important to learn because it is used by all of the Bitcoin and Lightning projects I have encountered (correct me if I’m wrong!), and technical documentation often uses git and it would be great if you contribute typos, corrections, improvements, and additions “upstream” as you work through the docs. GitHub.com is a web service that is built on top of git with a GUI, but git is generally interacted with locally (on your computer/laptop) using the CLI. Here are resources and tutorials for getting started with git: https://try.github.io/
Bitcoin Improvement Proposals (BIPs) are a hodgepodge, so maybe focus on the ones that seem to crop up often in your readings. I wouldn’t necessarily recommend trying to sit down and reading them all from beginning to end. Here they all are: https://github.com/bitcoin/bips/blob/master/README.mediawiki
I highly recommend carefully reading through these BOLTs from beginning to end, a couple of times if needed! They are, or should be, understandable for non-developers (if something is not clear, research to reword the BOLT and submit a pull request!).
If you stopped here you would have a very solid amount of computer experience, at least a basic understanding of the technical side of BTC/LN, and a clear path to experimenting with other people’s software. But maybe you want to write your own software!
Programming
I think that if you try to learn programming topics that are directly related to the most popular Bitcoin implementation (“Bitcoin Core”, also called “bitcoind”) then you’ll probably overwhelmed. To my knowledge there are no smooth learning curves for learning C++. I think its easier to learn a language like Python first, as it hides a lot of complexity and allows you to focus on mastering the basics of programming logic first. Coincidentally, the Bitcoin Core test suite is written in Python.
Warning: Programming is a notoriously frustrating experience. You will *repeatedly* have errors that take you hours to figure out (and the cause was “dumb”, maybe a typo). Please understand that this is everyone’s experience, you are not alone! Aggressively use Google early and often when you run into errors. If you solve the problem with a Google search, think about how you could have avoided the error in the first place and how you can detect the cause and fix it without Google. This will allow you to get faster at “debugging”. Eventually, you’ll write large amounts of code that don’t have too many “simple” obvious bugs, the code will just have really complicated and insidious bugs!
Often, an integrated development environment (IDE) can automatically point out problems to you so you have decades of programmer experience helping you out. Personally I’ve enjoyed using the IDE maker JetBrains over the years in all languages. For Python they have PyCharm (the community edition is free, the pro edition is free for college students) https://www.jetbrains.com/pycharm/.
You can also recreate a Codecademy-like environment that is web-based and highly interactive with Jupyter IPython https://ipython.org/ I really recommend this for rapidly iterating with experiments.
If after that experience you get addicted to programming and Python like I did, check out https://docs.python-guide.org/
You can probably find the same combination of interactive tutorial + simple web framework tutorial for any modern programming language. A popular programming language is JavaScript because it can be used both inside a user’s web browser as well as on the server hosting the web content.
“Full stack” web development led to me learning about relational and document databases, key/value stores , message queues, concurrency, networking, etcetera that are either somewhat or completely applicable to BTC/LN programming. Having said that, you can learn all about these concepts by working on BTC/LN itself instead of unrelated web development like I did!
When you become proficient and comfortable with “hobbyist scripting”, start challenging yourself. Whatever modern programming language you’re using, there are “intermediate” and “advanced” books on topics like object-oriented and functional programming. There are also very interesting books that are generically about software architecture, code quality, development methodology, testing, and so on. You can always improve your programming chops by learning shiny new languages, reading code that is widely seen as high quality, and asking for a code review on StackExchange: https://codereview.stackexchange.com/
At this point, if you want to hack inside of Bitcoin Core, you’re going to have to learn C++! Alternatives are btcd which is written in go and is generally considered to be easier to read, or bcoin which is written in JavaScript.
Before you start on your C++ adventure, consider doing a detour to Rust as it may smooth the learning curve.
I found it helpful to build examples using xeus-cling https://github.com/QuantStack/xeus-cling which is IPython but for C++. I found this helpful to make iteration faster than the traditional C++ environment of having to constantly recompile.
I built a website for seeing all the Bitcoin Core pull requests that can give you an idea of what’s in the pipeline and how far along it is in the review process: https://bitcoinacks.com/
Programming + Bitcoin Bootcamps
Each bootcamp has a different focus, visit their websites for topics, dates, and pricing:
I predict that the project by Facebook called Libre will fail. It may change it's name too, but ultimately it will fail. It will bring more interest and make Bitcoin seem attractive.
Abstract. A purely peer-to-peer version of electronic cash would allow online payments to be sent directly from one party to another without going through a financial institution. Digital signatures provide part of the solution, but the main benefits are lost if a trusted third party is still required to prevent double-spending.We propose a solution to the double-spending problem using a peer-to-peer network.The network timestamps transactions by hashing them into an ongoing chain of hash-based proof-of-work, forming a record that cannot be changed without re doing the proof-of-work. The longest chain not only serves as proof of the sequence of events witnessed, but proof that it came from the largest pool of CPU power. As long as a majority of CPU power is controlled by nodes that are not cooperating to attack the network, they'll generate the longest chain and outpace attackers. The network itself requires minimal structure. Messages are broadcast on a best effort basis, and nodes can leave and rejoin the network at will, accepting the longest proof-of-work chain as proof of what happened while they were gone.
Bitcoin will be regulated to death. How? Bitcoin exchanges will be unable to on-ramp fiat customers due to a ban by the banking industry. The banking industry will be regulated and ordered to not allow fiat transactions to or from exchanges. With exchanges barred from fiat banking, the price of Bitcoin will plummet and holders (hodlers) will sell. Bitcoin will become worthless and will die. This is what exchanges and their executives fear the most.
Doing simple analysis of Bitcoin in log view on Trading View. It seems too good to be true for Bitcoin in the next few years. A big part of me thinks we are missing something, and it is too good to be true. I think the undoing will be human greed, whereby transferring to real world assets and fiat currency will eventually mean the log charts we are all hopefully of, will never materialize.
Bitcoin is the first and only digital object that is both quantifiably scarce and provably secure. This makes Bitcoin the next logical evolution in money… its just better money. In the world of commodities, there is a spilt between monetary assets, those with a high stock-to-flow (SF) ratio, and standard commodities which have a utility value [1]. This matters because Bitcoin as the next money is just digital gold. Commodities with a SF above 1 are incredibly rare. Only Gold and Silver have SFs meaningfully above 1.
Stock-to-Flow (SF) = available stockpiles / annual production
In Q2 of 2019 Bitcoin had a stock of 17.5M and a flow of about 700,000 bitcoins per year. This means Bitcoin has a Stock-to-Flow of 25. This puts it right into the monetary category, just above silver, and well below gold.
Once every four years...
There is a halving where the number of Bitcoins created diminishes by half [2]. What you notice is that these halvings become very important because they double the stock to flow ratio of Bitcoin. In May 2020, Bitcoin will undergo the third of it's quadrennial halvings, doubling Bitcoin’s SF to 50.
Money is important
Not only because of it’s financial implications, but also, because just like language, money is key for human cooperation. Better money leads to better cooperation. And money is but a technology which can be improved upon. Rather, it is a technology which has already been improved upon [3].
Bitcoin is a real piece of art, its deep, its fundamental and yet simple….
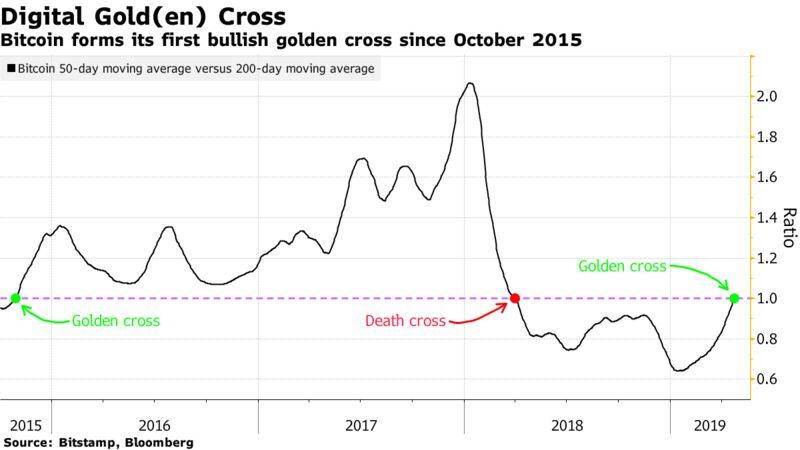
First Golden Cross for Bitcoin in 3 Years as Bulls Return
Here’s yet another sign the crypto winter is thawing. Bitcoin, the largest digital currency, has formed its first bullish golden cross since October 2015, according to Bitstamp pricing that includes weekend moves. The milestone follows a 35 percent rally for Bitcoin past $5,600, on track for its best monthly gain since the height of the crypto frenzy in December 2017. The sudden resurgence has also been apparent in other parts of the market, including record contract trading volumes in the futures market at CME Group Inc. earlier this month.
Bitcoin uses a specific elliptic curve and set of mathematical constants, as defined in a standard called secp256k1, established by the National Institute of Standards and Technology (NIST). The secp256k1 curve is defined by the following function, which produces an elliptic curve:
y 2 = (x 3 + 7)over(? p)
or
y 2 mod p = (x 3 + 7) mod p
The mod p (modulo prime number p) indicates that this curve is over a finite field of prime order p, also written as ? p, where p = 2256 - 232 - 29 - 28 - 27 - 26 - 24 - 1, a very large prime number.
Satoshi Nakamoto published the bitcoin white paper 31/Oct 2008 [1], created the bitcoin genesis block 03/Jan 2009, and released the bitcoin code 08/Jan 2009. So begins a journey that leads to a $70bn bitcoin (BTC) market today.
Bitcoin is the first scarce digital object the world has ever seen. It is scarce like silver & gold, and can be send over the internet, radio, satellite etc.
" As a thought experiment, imagine there was a base metal as scarce as gold but with the following properties: boring grey in colour, not a good conductor of electricity, not particularly strong [..], not useful for any practical or ornamental purpose .. and one special, magical property: can be transported over a communications channel" — Nakamoto [2]
Surely this digital scarcity has value. But how much? In this article I quantify scarcity using stock-to-flow, and use stock-to-flow to model bitcoin’s value.
Scarcity and Stock-to-Flow
Dictionaries usually define scarcity as 'a situation in which something is not easy to find or get', and 'a lack of something'.
Nick Szabo has a more useful definition of scarcity: 'unforgeable costliness'.
"What do antiques, time, and gold have in common? They are costly, due either to their original cost or the improbability of their history, and it is difficult to spoof this costliness. [..] There are some problems involved with implementing unforgeable costliness on a computer. If such problems can be overcome, we can achieve bit gold." — Szabo [3]
"Precious metals and collectibles have an unforgeable scarcity due to the costliness of their creation. This once provided money the value of which was largely independent of any trusted third party. [..][but] you can’t pay online with metal. Thus, it would be very nice if there were a protocol whereby unforgeably costly bits could be created online with minimal dependence on trusted third parties, and then securely stored, transferred, and assayed with similar minimal trust. Bit gold." — Szabo [4]
Bitcoin has unforgeable costliness, because it costs a lot of electricity to produce new bitcoins. Producing bitcoins cannot be easily faked. Note that this is different for fiat money and also for altcoins that have no supply cap, have no proof-of-work (PoW), have low hashrate, or have a small group of people or companies that can easily influence supply etc.
Saifedean Ammous talks about scarcity in terms of stock-to-flow (SF) ratio. He explains why gold and bitcoin are different from consumable commodities like copper, zinc, nickel, brass, oil, because they have high SF.
"For any consumable commodity [..] doubling of output will dwarf any existing stockpiles, bringing the price crashing down and hurting the holders. For gold, a price spike that causes a doubling of annual production will be insignificant, increasing stockpiles by 3% rather than 1.5%."
"It is this consistently low rate of supply of gold that is the fundamental reason it has maintained its monetary role throughout human history."
"The high stock-to-flow ratio of gold makes it the commodity with the lowest price elasticity of supply."
"The existing stockpiles of Bitcoin in 2017 were around 25 times larger than the new coins produced in 2017. This is still less than half of the ratio for gold, but around the year 2022, Bitcoin's stock-to-flow ratio will overtake that of gold" — Ammous[5]
So, scarcity can be quantified by SF.
SF = stock / flow
Stock is the size of the existing stockpiles or reserves. Flow is the yearly production. Instead of SF, people also use supply growth rate (flow/stock). Note that SF = 1 / supply growth rate.
Let’s look at some SF numbers.
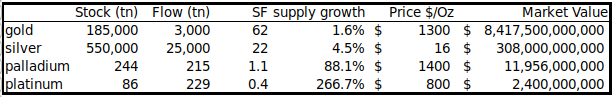
Gold has the highest SF 62, it takes 62 years of production to get current gold stock. Silver is second with SF 22. This high SF makes them monetary goods.
Palladium, platinum and all other commodities have SF barely higher than 1. Existing stock is usually equal or lower than yearly production, making production a very important factor. It is almost impossible for commodities to get a higher SF, because as soon as somebody hoards them, price rises, production rises, and price falls again. It is very hard to escape this trap.
Bitcoin currently has a stock of 17.5m coins and supply of 0.7m/yr = SF 25. This places bitcoin in the monetary goods category like silver and gold. Bitcoin's market value at current prices is $70bn.
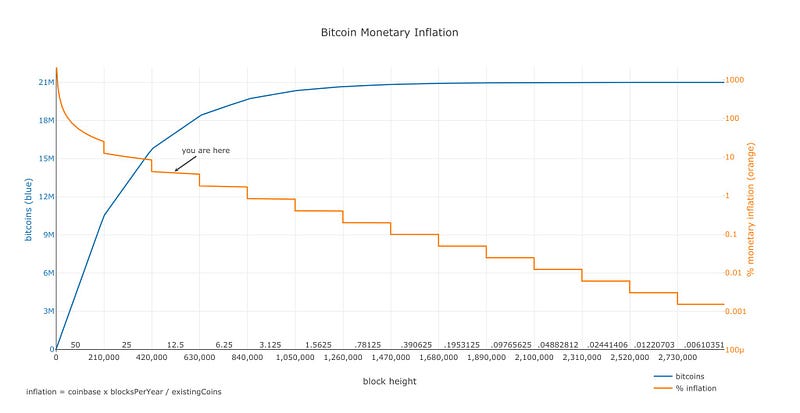
Supply of bitcoin is fixed. New bitcoins are created in every new block. Blocks are created every 10 minutes (on average), when a miner finds the hash that satisfies the PoW required for a valid block. The first transaction in each block, called the coinbase, contains the block reward for the miner that found the block. The block reward consists of the fees that people pay for transactions in that block and the newly created coins (called subsidy). The subsidy started at 50 bitcoins, and is halved every 210,000 blocks (about 4 years). That's why 'halvings' are very important for bitcoins money supply and SF. Halvings also cause the supply growth rate (in bitcoin context usually called 'monetary inflation') to be stepped and not smooth.
source: https://plot.ly/~BashCo/5.embed
Stock-to-Flow and Value
The hypothesis in this study is that scarcity, as measured by SF, directly drives value. A look at the table above confirms that market values tend to be higher when SF is higher. Next step is to collect data and make a statistical model.
Data
I calculated bitcoin's monthly SF and value from Dec 2009 to Mar 2018 (111 data points in total). Number of blocks per month can be directly queried from the bitcoin blockchain with Python/RPC/bitcoind. Actual number of blocks differs quite a bit from the theoretical number, because blocks are not produced exactly every 10 minutes (e.g. in the first year 2009 there were significantly less blocks). With the number of blocks per month and known block subsidy, you can calculate flow and stock. I corrected for lost coins by arbitrarily disregarding the first million coins (7 months) in the SF calculation. More accurate adjusting for lost coins will be a subject for future research.
Bitcoin price data is available from different sources but starts at Jul 2010. I added the first known bitcoin prices (1$ for 1309 BTC Oct 2009, first quote of $0.003 on BitcoinMarket Mar 2010, 2 pizza's worth $41 for 10,000 BTC May 2010) and interpolated. Data archeology will be a subject for future research.
We already have the data points for gold (SF 62, market value $8.5trn) and silver (SF 22, market value $308bn), which I use as a benchmark.
Model
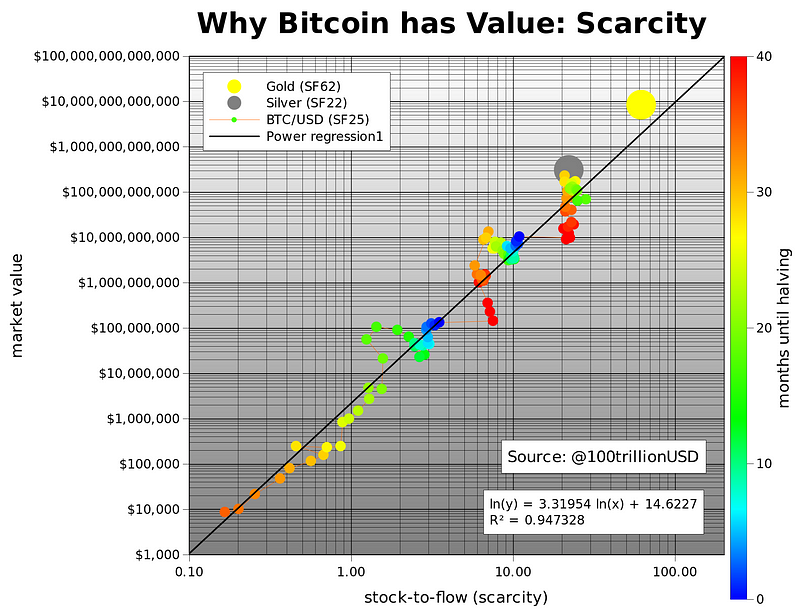
A first scatter plot of SF vs market value shows that it is better to use logarithmic values or axis for market value, because it spans 8 orders of magnitude (from $10,000 to $100bn). Using logarithmic values or axis for SF as well reveals a nice linear relationship between ln(SF) and ln(market value). Note that I use natural logarithm (ln with base e) and not common logarithm (log with base 10), which would yield similar results.
Fitting a linear regression to the data confirms what can be seen with the naked eye: a statistically significant relationship between SF and market value (95% R2, significance of F 2.3E-17, p-Value of slope 2.3E-17). The likelihood that the relationship between SF and market value is caused by chance is close to zero. Of course other factors also impact price, regulation, hacks and other news, that is why R2 is not 100% (and not all dots are on the straight black line). However, the dominant driving factor seems to be scarcity / SF.
Charts made with gnuplot and gnumerics
What is very interesting is that gold and silver, which are totally different markets, are in line with the bitcoin model values for SF. This gives extra confidence in the model. Note that at the peak of the bull market in Dec 2017 bitcoin SF was 22 and bitcoin market value was $230bn, very close to silver.
Because halvings have such a big impact on SF, I put months until the next halving as a color overlay in the chart. Dark blue is the halving month, and red is just after the halving. Next halving is May 2020. Current SF of 25 will double to 50+, very close to gold (SF 62).
The predicted market value for bitcoin after May 2020 halving is $1trn, which translates in a bitcoin price of $55,000. That is quite spectacular. I guess time will tell and we will probably know one or two years after the halving, in 2020 or 2021. A great out of sample test of this hypothesis and model.
People ask me where all the money needed for $1trn bitcoin market value would come from? My answer: silver, gold, countries with negative interest rate (Europe, Japan, US soon), countries with predatory governments (Venezuela, China, Iran, Turkey etc), billionaires and millionaires hedging against quantitative easing (QE), and institutional investors discovering the best performing asset of last 10 yrs.
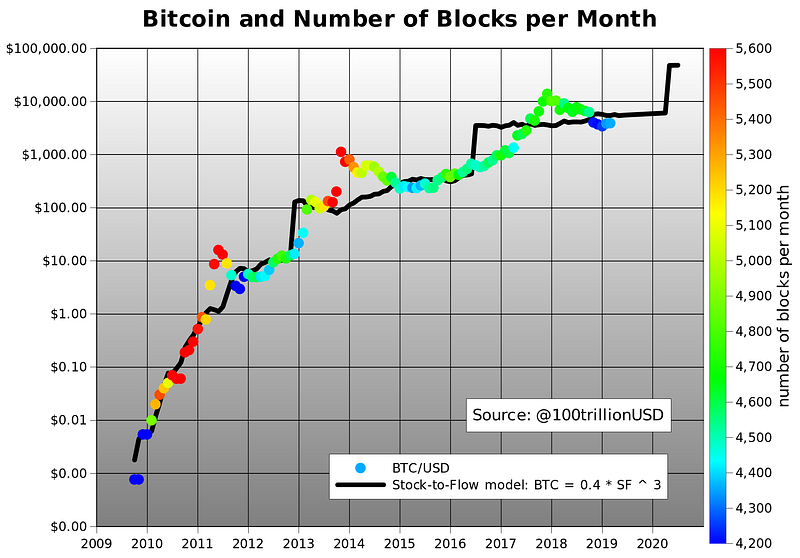
We can also model bitcoin price directly with SF. The formula of course has different parameters, but the result is the same, 95% R2 and a predicted bitcoin price of $55,000 after May 2020 halving. I plotted bitcoin model price based on SF (black) and actual bitcoin price over time, with the number of blocks as color overlay.
Charts made with gnuplot and gnumericsvery close
Notice the goodness of fit, especially the almost immediate price adjustment after Nov 2012 halving. Adjustment after Jun 2016 halving was much slower, possibly due to Ethereum competition and the DAO hack. Also, you see less blocks per month (blue) in the first year 2009 and during downward difficulty adjustments end2011, mid2015 and end2018. Introduction of GPU miners in 2010-2011 and ASIC miners in 2013 resulted in more blocks per month (red).
Power Laws and Fractals
Also very interesting is that there is indication of a power law relationship.
The linear regression function: ln(market value) = 3.3 * ln(SF)+14.6
.. can be written as a power law function: market value = exp(14.6) * SF ^ 3.3
Power laws are scarce, you don’t find them very often. The possibility of a power law with 95% R2 over 8 orders of magnitude, ads confidence that the main driver of bitcoin value is correctly captured with SF.
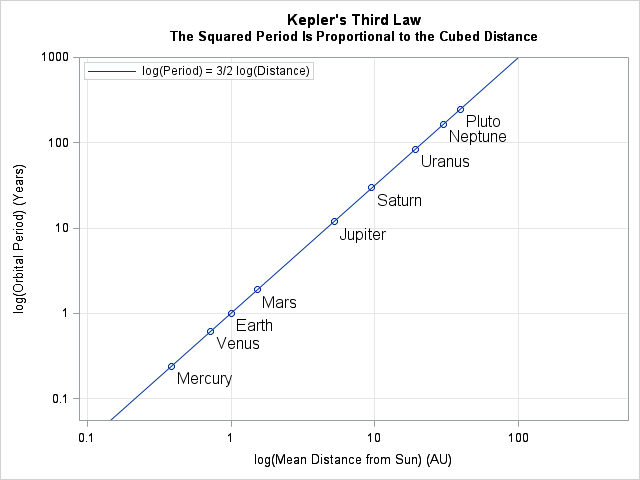
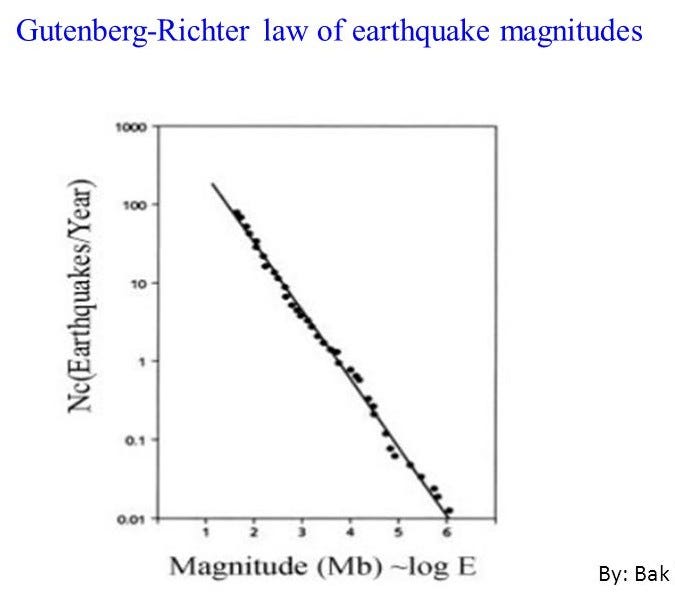
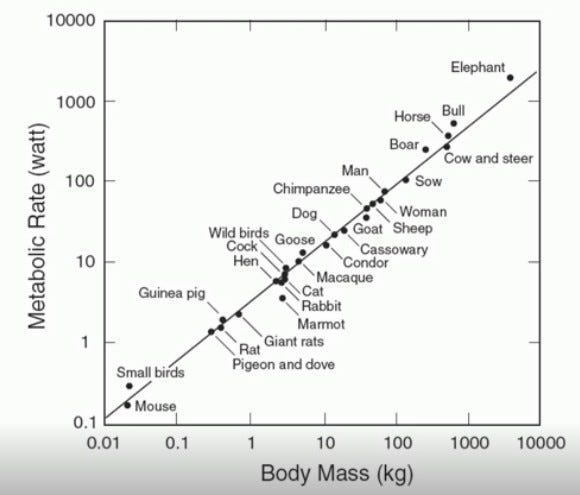
A power law is a relationship in which a relative change in one quantity gives rise to a proportional relative change in the other quantity, independent of the initial size of those quantities. [6]. See appendix for some famous power law examples.
Power laws are interesting because they reveal an underlying regularity in the properties of seemingly random complex systems. Complex systems usually have properties where changes between phenomena at different scales are independent of the scales we are looking at. The picture we take at one scale is therefore similar in some way to the picture we take at another scale. This self-similar property underlies power law relationships . We see this in Bitcoin too: 2011, 2014 and 2018 crashes look very similar (all have -80% dips) but on totally different scales (resp. $10, $1000, $10,000), if you don't use log scales, you will not see it. Scale in-variance and self-similarity has a link with fractals. In fact, parameter a in the power law function above is the 'fractal dimension'. For more information on fractals see the famous study of length of coastlines [7]. Power laws and fractals in bitcoin will be a subject for future research.
Conclusion
Bitcoin is the first scarce digital object the world has ever seen, it is scarce like silver & gold, and can be send over the internet, radio, satellite etc.
Surely this digital scarcity has value. But how much? In this article I quantify scarcity using stock-to-flow, and use stock-to-flow to model bitcoin’s value.
A statistically significant relationship between stock-to-flow and market value exists. The likelihood that the relationship between stock-to-flow and market value is caused by chance is close to zero.
Adding confidence in the model:
Gold and silver, which are totally different markets, are in line with the bitcoin model values for SF.
There is indication of a power law relationship.
The model predicts a bitcoin market value of $1trn after next halving in May 2020, which translates in a bitcoin price of $55,000.