Thursday, September 27, 2018

An In-Depth Look at the Economics of Bitcoin

https://www.cmegroup.com/education/featured-reports/an-in-depth-look-at-the-economics-of-bitcoin.html

An In-Depth Look at the Economics of Bitcoin

What is most striking about the economics of bitcoin is the juxtaposition of the certainty of supply and the uncertainty of demand. The rate at which bitcoin is mined has been highly predictable and, unlike almost any other asset, currency or commodity, its ultimate supply is a known quantity, fixed in advance. There will never be more than 21 million coins. This feature makes bitcoin supply almost perfectly inelastic. No matter how high the price rises, miners will not ultimately produce any more than the prescribed amount. Moreover, price rises will not even necessarily incentivize a more rapid mining of bitcoin. Even if they did, it would mean miners create more bitcoin today at the expense of creating less of it in the future since the total supply will reach a hard, asymptotic limit of 21 million coins, expected to be reached by 2140 or so, based on the mining algorithms.
In this report we analyze the economics of the bitcoin marketplace by finding parallels in the world of commodities to understand what it means to have an inelastic supply. Then, we move to the relatively more difficult task of demand analysis to complete the bitcoin economics picture.

1.Economics of Supply Inelasticity

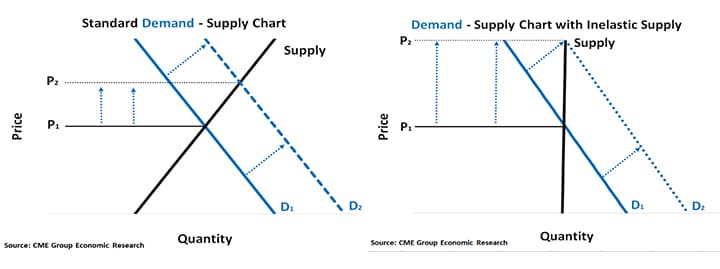
The supply inelasticity explains in large part why bitcoin is so volatile. Items with inelastic supply show a greater response to demand shifts than items with elastic supply. The same is true of demand: the more inelastic the demand, the greater the price changes in response to small fluctuations in either supply or demand. In the abstract example below, we show the relatively modest price response to an upward shift in demand for a market with flexible supply elasticity on the left and contrast it with the much bigger price response from the same demand shift in a constrained supply market on the right.

Figure 1: Elastic Supply (Left) is Less Price Volatile Than Inelastic Supply Markets (Right).

Figure 1: Elastic Supply (Left) is Less Price Volatile Than Inelastic Supply Markets (Right).
Take as an illustration the case of natural gas.  Natural gas is a classic example of a market with highly inelastic supply and demand. If prices soar today, consumers will still need natural gas to generate electricity, heating and to fuel industrial processes; and they will be willing to pay up for it, at least in the short term. Natural gas demand is therefore highly inelastic.

Figure 2: Inelastic Expansion and the Slowing Growth of Bitcoin Supply.

Figure 2: Inelastic Expansion and the Slowing Growth of Bitcoin Supply.
The same is true of natural gas supply. If prices double, producers will likely not be able to supply a great deal more of it in the short term. Similar relationships hold for crude oil, although are less dramatic. What differentiates the analysis of commodities like natural gas and crude oil from bitcoin is that their long-term supply and demand shows a meaningful degree of elasticity, even if the short-term supply is more about inventory swings than production adjustments. If natural gas or crude oil prices experience a sustained rise, producers can and will find ways of producing more of them – or at least they have so far in history.
Meanwhile, consumers will find ways to use them more efficiently in response to higher prices. This is not the case for bitcoin directly, although rising prices might increase the probability of “forks” that split bitcoin into the original and a spinout currency such as Bitcoin Cash (August 1, 2017), Bitcoin Gold (October 24, 2017), and Bitcoin Private (February 28, 2018).
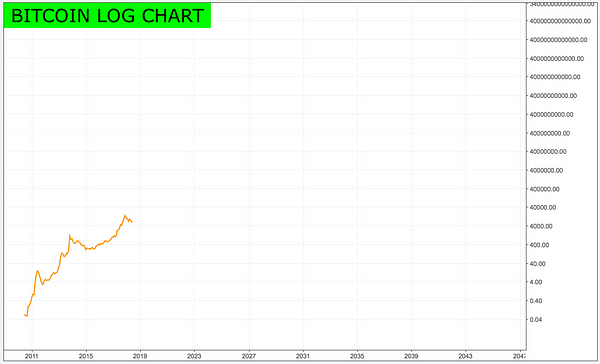
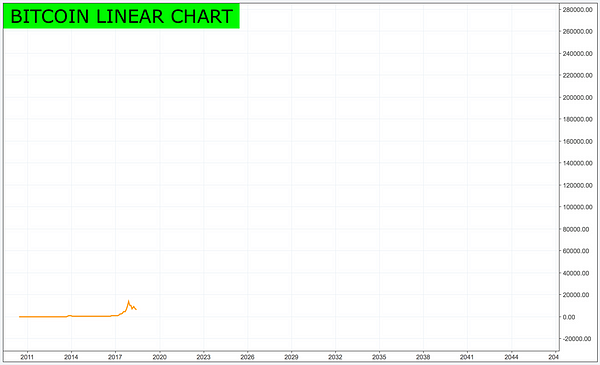
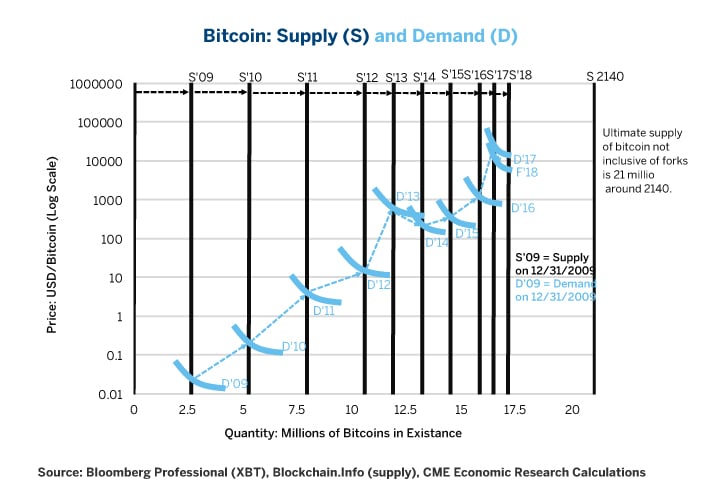
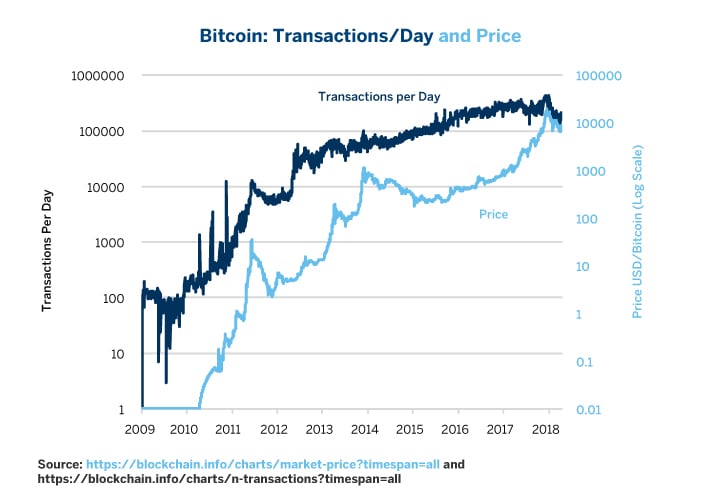
Bitcoin’s limited and highly inelastic supply is also a major factor driving its price appreciation, a rise so spectacular that it can only be appreciated when seen on a log scale. In bitcoin’s first four years, supply grew by roughly 2.5 million coins per year. Even then prices were rising as the user community grew. Since then supply has continued to grow but the pace has slowed substantially while demand has occasionally dipped, even on a year-on-year basis.           
Bitcoin’s limited supply and soaring price make it difficult to be used as a medium of exchange outside of the crypto currency space. Imagine one’s regret if one uses bitcoin to purchase a mundane item such as a cup of coffee only to find that the bitcoin spent on a cup of coffee would have been worth millions of dollars a few years later. As such, investors treat bitcoin as a highly unreliable store of value – a bit like gold on steroids.
One often asked question is: will bitcoin replace fiat currencies such as the U.S. dollar? We think that the answer is a resounding no. Bitcoin’s price is too volatile to compete as a store of value; Bitcoin’s transaction costs are too high and too variable for it to be used as a medium of exchange.
Most importantly, for an asset to function economically as a medium of exchange, it must depreciate slowly over time – something that is impossible with a fixed supply. That loss of value is precisely what makes them useful. Without the fear of inflation, holders of currency tend to hoard rather than spend it.  This is why most major central banks, such as the Federal Reserve, European Central Bank, and the Bank of Japan, for example, have set modest inflation targets of 2%, as suggested back in the 1960s by Professor Milton Friedman.  The inflation target creates a dis-incentive to hoard the currency, since hoarding a currency depresses economic growth and creates financial instability.  The Japanese yen, the one fiat currency that has experienced deflation over the past few decades, is a case in point.  Far from being a virtuous store of value, the Japanese deflation produced a depressed, underperforming economy that the Bank of Japan is desperately trying to turn around with a colossal quantitative easing program four times bigger than that undertaken by the Federal Reserve or European Central Bank, relative to the size of the Japanese economy.

2. A Deep Dive into Bitcoin Supply through a Study of the Economics of Commodities

Bitcoin is “mined” by computers solving cryptographic math problems. In exchange for solving the problems, miners receive bitcoin. Those math problems grow in difficulty over time, increasing the required computational power required to solve them. This in turn drives up the equipment and especially the electricity cost of producing bitcoins. One needs more and more computers and to make them run at peak speeds, they must be kept cool.
This makes the economic analysis of bitcoin a bit like energy and metals. For example, as of late 2017, the swing producers of crude oil in the U.S. were probably profitable at around $40 per barrel.  Above that price, there are incentives to add to production.  Below that price, the incentives are to curtail production.  Also like bitcoin, the difficulty of extracting energy from the earth has increased substantially over time. For instance, humanity went through the easiest oil supplies located near the surface many decades ago. Now marginal supply increases come mostly from fracking deep under the ground, from offshore drilling or from oil in remote, difficult to access locations. In the second half of the 19th century, when oil was first produced in large quantities, one unit of energy invested in oil extraction produced around 150 units of energy. By the 1970s that was down to around 30 units of energy for each one invested and that ratio fell to around 15 by 2000 and is probably below 10 today. This has been a factor in driving oil prices higher. In the energy industry, it is widely assumed that the marginal producers have a cost of production near $40 per barrel. It bears mentioning that oil prices rarely traded at $40 until about 2005, when they rose above that level and have only occasionally looked back.
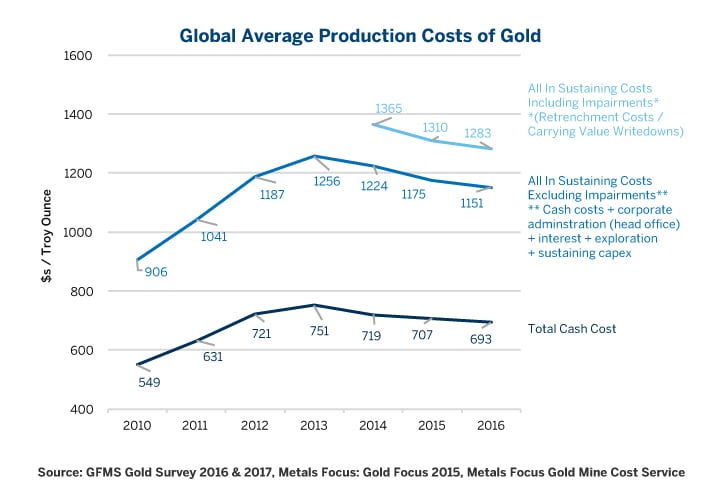
For metals like copper, gold and silver, there are two numbers to watch: the cash cost and all-in sustaining costs. Cash costs give one a sense of price levels at which producers will maintain current production. All-in sustaining costs give one a sense of what current and anticipated future price levels will be necessary to incentivize additional investment in future production. For example, for gold, cash-cost for mine operators averages around $700 per ounce while the all-in sustaining costs are around $1,250 per ounce (Figure 3).

Figure 3: The Cost of Mining Gold

Figure 3:  The Cost of Mining Gold
What is interesting for gold, silver and copper is that after their prices began to fall in 2011, it squeezed the profit margins of operators, who in turn found ways to streamline their businesses and cut their production costs.  The same is true of the 2014-16 collapse in energy prices which may have lowered the marginal cost of production from $50 to $40 per barrel of crude. Like mining metals and extracting fossil fuels, mining bitcoin is also a competitive business. Not surprisingly we see a similar feedback loop between the bitcoin price and mining-supply difficulty – in this case difficulty is measured in terms of the number of calculations required to solve the crypto-algorithm to unlock a few more bitcoins in the mining process.
Glancing at Figure 4, it is obvious that as the required number of computations (“difficulty”) has risen, producing bitcoin has become more expensive. It is not a stretch of the imagination to hypothesize that the exponential rise in the difficulty of mining bitcoin has contributed to the exponential rise in price. True, perhaps, but not the complete story. There is another side to this feedback loop. Notice what happened to “difficulty” after the first bitcoin bear market (a 93% drop) in 2010-11. Its inexorable rise came to a two-year long halt until prices recovered. It was only once when the next price bull market began in 2013 that “difficulty” began increasing again. A similar phenomenon occurred in the aftermath of the 2013-15 bitcoin bear market (an 84% decline). There too “difficulty” stagnated until prices began their next bull market. Curiously “difficulty” has not begun to stagnate yet despite a 50% drop in bitcoin prices from their recent highs. The relationship between “difficulty” and price trends suggest that bitcoin may remain in a congested pattern for some time to come.

Figure 4: Bitcoin Difficulty and Price.

Figure 4: Bitcoin Difficulty and Price.
Thus, bitcoin supply appears to have at least one similarity with that of energy and metals.  When prices fall producers must take measures that cause production costs to stagnate or even fall.  While “difficulty” never appears to decline, the cost of computing power has fallen over time by as much as 25% per year. As such, if “difficulty” goes sideways for a year, the actual cost of production probably falls as the amount of energy needed to perform the same number of calculations declines. Just as metals and energy producers find ways to reduce cost after bear markets, the bitcoin mining community appears to do the same.
One last comment on supply before we move on to demand: it has long been rumored that the founding community of bitcoin controls something in the order of 3-5 million coins. If this is true, in theory higher prices could (and probably would) encourage them to part with their coins in exchange for fiat currencies or other assets. When one takes this into account, bitcoin supply might not be perfectly inelastic in the very short term. A similar phenomenon exists in precious metals. When prices rise, we see an increase in the recycling of gold and silver (secondary supply). What is interesting, however, is that that recycling appears to respond to price but does not drive prices. For gold and silver, the only supply that appears to drive price is mining supply. Likewise, if an existing holder of bitcoin liquidates some or all of her holdings, this increases its short-term availability but does nothing to influence its total long-run supply, and in that sense, is more like a temporary inventory adjustment.

3. Demand Drivers are Not So Transparent

While bitcoin supply is extremely transparent, bitcoin demand is rather opaque. That said, there are a few quantifiable items that we do know about bitcoin demand. First, we have a pretty good idea of the number of bitcoin transactions performed each day. Secondly, and more importantly, it appears that fluctuations in bitcoin transaction costs play a major role in determining price corrections.
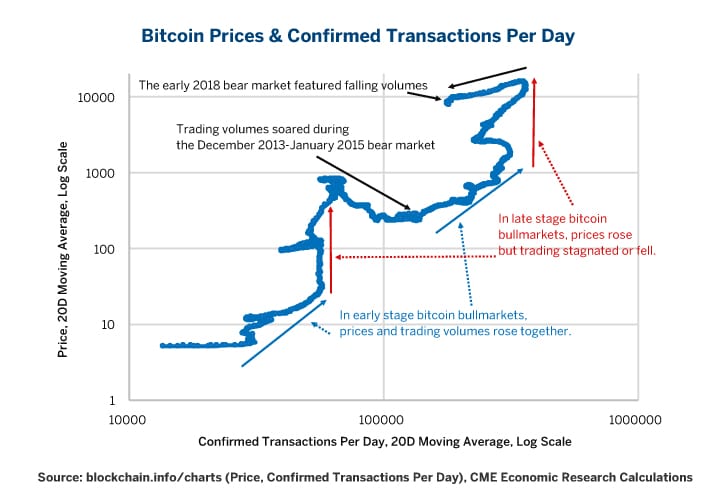
There appears to be a loose relationship between the growth rate of transactions and the rise/decline in price. For example, the number of transactions stopped growing in 2012, about one year before bitcoin’s 2013 peak and bear market. It began to rise again in 2014 before bitcoin prices began to recover in earnest but has been stagnating since the end of 2016 (Figures 5 and 6), perhaps foreshadowing the recent correction. What is particularly striking about the most recent correction is that the number of transactions have not risen as prices have fallen as they did during the December 2013-January 2015 bear market. During the two previous bull markets, the number of transactions began rising well in advance of the actual rally in bitcoin prices. Towards the end of the two previous bull markets, prices soared as the number of transactions stopped rising.

Figure 5: Does Bitcoin Volume Drive Price?

Figure 5: Does Bitcoin Volume Drive Price?

Figure 6: Relation between prices and transactions

Figure 6:  Relation between prices and transactions
The relationship between bitcoin prices and transaction costs is even more compelling. Trading costs spiked from $2 to around $30 per transaction in late 2010 just before bitcoin prices suffered a 93% collapse. As bitcoin transaction costs subsequently fell, another bull market developed. Transaction costs edged higher in 2012 and then soared to over $80 by early 2013 which coincided with another collapse in bitcoin prices. By 2015, transaction costs eased towards $8 and another bull market began. Starting in late 2016, they began to rise again and are now up towards $100-$150 per transaction (Figures 7 and 8). This third spike in transaction costs may be closely related to the recent correction in bitcoin prices as high transaction costs may play a role in causing demand for the cryptocurrency to wither.

Figure 7: What Level of Bitcoin Transaction Costs Can the Market Sustain?

Figure 7: What Level of Bitcoin Transaction Costs Can the Market Sustain?

Figure 8: Relation of prices to transactions costs

Figure 8:  Relation of prices to transactions costs
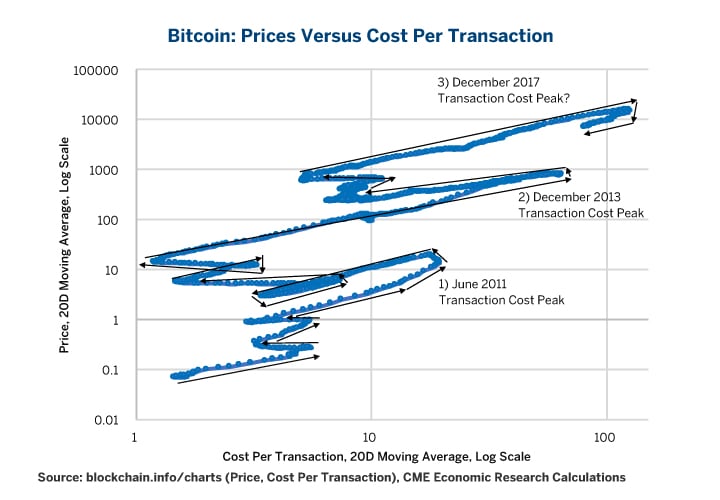
We are not suggesting that bitcoin prices are a function of trading costs or vice versa; however, there is an association between the two with mutual feedback loops.  When bitcoin prices rise, eventually transaction costs appear to rise as well. When transaction costs reach levels that market participants can no longer bear, the price of bitcoin often corrects. A decline in prices puts downward pressure on transaction costs which, at least in the past, allowed for another bitcoin bull market once they had corrected to lower levels.
If stagnating numbers of trades and rising transaction do in fact play a role in provoking bitcoin price corrections, then one might hypothesize that a given correction might last until transaction costs fall and the number of transactions begins to rise again. Given the spike in transaction costs in early 2018 and the sharp (more than 50%) decline in the number of transactions being recorded in bitcoin during the same period, if these variables are in fact drivers of bitcoin prices, the price of bitcoin may have not yet found its balancing point. Although bitcoin prices are down about 50% from their recent highs, do not forget that in bitcoin’s two previous routs it fell by 84-93%. What happens to bitcoin prices going forward is, of course, unknowable at present. That said, we would keep any eye on these factors as proxies for the health of bitcoin demand.

4. Incentives, Bitcoin Forks and Alternative Cryptocurrencies

When one thinks of incentives and reward structures, one might want to analyze some parallels with how shareholder value is created. This is tricky with bitcoin. Bitcoin certainly does not fit the definition of a company.  It has no board of directors, no balance sheet, no income statement and no cash flow statement. That said, bitcoin does have a couple of features which need to be understood in the context of incentive structures. And, this adds a little more complexity to the supply analysis as well.
Miners and transaction validators receive rewards in bitcoin. One can see a corporation’s shares as an internal currency used to compensate and motivate employees, aligning their interests with those of the organization. To that end, the number of bitcoins in existence is comparable to the “float” of a corporation – the number of shares issued to the public.
When bitcoin forks into a new currency, such as Bitcoin Cash, the move can be analyzed in a manner comparable to a corporate action such as a spin out.  In a spin out, a corporation can give each of its shareholders new shares in a division of the firm that is being released to the public as separate and independent entity. Likewise, when bitcoin most recently forked, the owner of each bitcoin received one unit of Bitcoin Cash, a new and separate cryptocurrency.
In a sense, bitcoin could be viewed as a reference index on the crypto currency space more generally. Many new alt-coins, in addition to copying bitcoin’s technology, are more easily purchased via bitcoin than they are by using fiat currencies. Bitcoin’s central role in this ecosystem makes its price a bit like an index on the health of the entire ecosystem itself. Not surprisingly, the prices of other cryptocurrencies like Ethereum and Ripple are highly correlated with bitcoin when seen from a fiat currency perspective.
A quick diversion back to supply is useful here. The existence of forks in bitcoin serves to modify some of our intuitions on supply. That is, while bitcoin’s supply is fixed, the supply of cryptocurrencies is not. Indeed, rising bitcoin prices incent bitcoin forks. This makes a lot of sense but it does complicate the analysis as it is a reminder that one should not look at bitcoin in isolation but as an anchor for the whole cryptocurrency space.

5. Economic Destiny of Bitcoin

Even if bitcoin fails to replace fiat currencies, it will not necessarily be without long-term economic impact. One possible result of the development of cryptocurrencies is that central banks may one day decide to issue their own distributed ledger currencies as Venezuela is struggling to attempt to do today with the launch of the “petro.” Former Fed Chairman Alan Greenspan once compared making monetary policy to driving a car guided only by a cracked rearview mirror. Even now, important policy decisions must be based upon imperfectly estimated economic numbers that are weeks or months old by the time they become available. In 2018, economic policy making is still a vestige of the 20th century.
Blockchain technology has the potential to allow policy makers to issue their own cryptocurrencies that will give them real time information on inflation, nominal and real GDP. It will not allow them to peer through the front windshield into the future but at least they can look into the rearview mirror with much greater clarity and see out the side windows of the monetary policy vehicle. This could allow them to create the amount of money and credit necessary to keep the economy growing at a smooth pace more easily than they do today. Switching off the gold standard vastly reduced economic volatility and improved per capita economic growth. Moving to blockchain-enhanced fiat currencies could further reduce economic volatility and, ironically, enable further leveraging of the already highly indebted global economy as people find ways to use capital more efficiently. More broadly, crypto-inspired investments could bring about new technologies that we cannot yet imagine.
Investors who are buying bitcoin are presumably hoping to find someone to sell to at a higher price. That said, there is more to bitcoin economically than just the theory of the greater fool. As more people bid up the price, the difficulty of solving bitcoin’s cryptographic algorithms increases. This in turn is driving up investment in more powerful and faster computing technology of both a traditional integrated circuit and non-traditional variety. Indeed, solving cryptographic problems may be one of the first tests facing quantum computers.
The problem is that investors in bitcoin and its peers are mainly out to make profits and not to finance or subsidize the development of distributed ledgers nor more powerful computers.

Bottom line:

  • Bitcoin supply is highly inelastic; and as with commodities, inelastic supply increases volatility.
  • “Difficulty” of mining bitcoin math problems and its price are in a feedback loop, where “difficulty” is a major driver of price, and price also influences “difficulty”.
  • Transaction volume may influence price trends, and rising transaction costs are a risk indicator for bitcoin.

Wednesday, September 26, 2018

Hyperbitcoinization: Winner Takes All (or how Bitcoin gets to $100,000,000)

https://medium.com/coinmonks/hyperbitcoinization-winner-takes-all-69ab59f9695f
TL;DR: Hyperbitcoinization is a state where Bitcoin becomes the world’s dominant form of money. Bitcoin is socially wired and can be adopted exponentially. As it gains traction it will seem to be an organic, self-organizing process. In the model shared below, Bitcoin is in the infrastructure buildout phase and an early form of money. However, when it passes a critical “tipping point” Bitcoin adoption, use and price will skyrocket.
With rapid global acceptance, the cost of rejecting Bitcoin will exceed the cost of adopting it. Bitcoin will begin to assume money’s traditional roles and gain institutional and government support. It will become all money and form the backbone of a new global economy.
At hyperbitcoinization I estimate Bitcoin will reach up to $100M per coin within 20 years and as early 2030. Current price is 0.01% of this future value. Bitcoin is currently experiencing “microbubbles” and future appreciation will continue nearly unabated until it plateaus at a stable price.
Bitcoin affords us the opportunity to radically change our relationship with money. You will own your money. Central bank machinations will come to an end. 20 years ago we could not imagine how the internet would change our lives. In the next 20 years Bitcoin will reframe our roles as citizens in a borderless, global economy.

Hyperbitcoinization is a theoretical state wherein Bitcoin displaces legacy currencies and becomes the dominant if not only method to exchange value. As Daniel Krawisz stated in his 2014 Satoshi Nakamoto Institute article:
Hyperbitcoinization is a voluntary transition from an inferior currency to a superior one, and its adoption is a series of individual acts of entrepreneurship rather than a single monopolist that games the system. — Daniel Krawisz, 2014
He goes on to call hyperbitcoinization a form of demonetization. That is, traditional currencies are supplanted by the superior use case of Bitcoin such that the value of other currencies is driven to 0.
This transformative event has also been described as a “tipping point” at which time rapid, mass adoption of Bitcoin is spurred by economic crisis in order to secure monetary stability and liquidity. Venezuela and Argentina have been proposed as an early models of hyperbitcoinization. During catastrophic national currency hyperinflation people choose/are forced to use Bitcoin to conduct their personal and business transactions.
Bitcoin maximalists posit that hyperbitcoinization is the end game. Bitcoin “wins” when all other currencies “fail.” Andreas M. Antonopoulos warns against this fearing an “all out currency war.” Vested interests will resist fundamental change to the way we manage our money. Advantages accrued to the establishment will be substantially mitigated or lost entirely in hyperbitcoinization.
However, Bitcoin’s “take over” of fiat may not be so implausible nor catastrophic. It can be organic and mutually beneficial. This article will examine how Bitcoin can become the world’s first universal currency in part through voluntary social drivers and its inherent sound monetary policy. A monetary policy that somewhat recalls the (early) era of the gold standard — as sound money it is chosen by the market and governments do not determine its supply nor value. I will also introduce a hyperbitcoinization growth model and propose a range of prices and dates for Bitcoin’s “singularity.”
Throughout the article the term “hyperbitcoinization” will refer to both the process and final outcome of global Bitcoin adoption.

Socially Wired Money

Our connected world collapses time and space. Today an individual with robust social media connections can potentially reach millions of people across the globe. Influencers drive followers to adopt, buy and co-promote products and ideas to their own social circles in near real-time. Consumers trust peer recommendations over any other form of advertising.
How does Bitcoin fit into this new paradigm?
Let’s first look at Everett Roger’s diffusion of innovation model. It describes how innovative ideas/technologies are adopted. The bell curve is divided into successive psychograhic stages. The light blue line sums each group over time and is called the S-curve of adoption. For this discussion we can think of the S-curve as Bitcoin’s price (or market value).
The S-curve of adoption. As successive groups adopt a new technology or idea market share rises. The tipping point (green circle) marks an inflection point and leads to rapid growth in adoption.
The early part of the curve is relatively flat and defines the slowest phase of adoption. This is where the product is attempting to gain traction and championed by innovators and early adopters. Rapid uptake begins at the “tipping point” when mass market awareness translates into adoption by successively larger cohorts. It roughly correlates to the end of the early adopter phase and marks the beginning of exponential growth. Near the plateau the most risk averse or skeptical join last.
Adoption, however, is not as clean.
U.S. household technology adoption rates. On the left major innovations over the last 120 years. On the right, older technologies have been removed. The “S-curve” of adoption rarely follows the textbook. Source: visualcapitalist.com.
Several of the S-curves demonstrate pauses/dips. Others have flattened slopes. And as we can see in the right chart newer technologies are much steeper. The tablet, smartphone and social media all introduced around 2005 show near vertical growth. Although accentuated on these linear short term graphs, once a technology gains momentum it becomes a near unstoppable force. What’s going on?
We have entered a new era where novel ideas, technology and information are shared in socially supportive environments. Our interactions increasingly exhibit network effects resulting in a key transformation of how innovation spreads—
The rate of growth itself is growing, leading to shorter, steeper adoption curves.
In fact we have seen this phenomenon in Bitcoin and most recently in the 2017 year end run up. Bitcoin’s price rose 3.6X in 35 days between November 12nd and December 17th. Public excitement and FOMO during this short time period reached manic levels. Bitcoin was omnipresent on social media sites and mainstream financial news. Google searches for Bitcoin peaked. Price climbed to an intraday high of nearly $20,000.
In just over a month Bitcoin’s price increased 3.6X.
Bitcoin revealed itself as socially wired sound money for a socially wired society. No organized group controls and advertises its value proposition. It is owned and marketed by users. This allows Bitcoin to be adopted at unheard of rates and at vast multiples. Bitcoin is a low friction innovation with few barriers to large scale adoption. Without a central authority to undermine its value, value is prescribed by people. No border can prevent it from being adopted anywhere as it is decentralized. Bitcoin becomes even more secure as more people use it.
As Bitcoin operates at the junction of currency with sound monetary properties and novel technology it is positioned to become dominant money by orders of magnitude. Viewed in the appropriate context, the path to hyperbitcoinization will include near vertical price appreciation phases interspersed with brief corrective cycles as seen in some of the examples above. During these pauses the infrastructure will continue to grow and subsequently support the next wave up.
The two charts below show Bitcoin is growing exponentially and has only just started its journey to hyperbitcoinization.
Log price chart on the left demonstrates Bitcoin’s network effects at play. Linear price chart on the right places Bitcoin’s price on the flat part of the S-curve of adoption at some time before the tipping point.

Bitcoin Growth Model

Satoshi Nakamoto ensured that Bitcoin’s ecosystem was primed for growth with a finite money supply and secure, decentralized network that incentivizes all participants to ensure Bitcoin’s well being.
Let’s use a growth model that combines the S-curve of adoption with the underlying events (i.e. catalysts) driving Bitcoin’s growth.
Classic mineral crystallization scheme. Aggregates (orange stars) join to form larger crystals. Once the crystallization process passes the tipping point (green circle) it grows exponentially as the energy of the system favors the crystal over individual units. Adpated from CrystEngComm.
The graph depicts a large mineral crystallization schematic — I think an apt model for Bitcoin’s growth and will lead us to an understanding of how hyberbitcoinization can be achieved in what may seem to be a relatively short period of time. The blue curve is nucleation rate which describes the formation of aggregates that ultimately combine to form a crystal lattice. The red line is the crystal growth rate with saturation/crystallization achieved at the top right and flat part of the S-curve. As we can see crystallization begins in earnest well after the equilibration and nucleation phases. The intersection of these two lines — labeled the “tipping point” — represents a narrow zone beyond which the growth process becomes exponential and the energy state of the system favors the crystal over loose, independent aggregates.
Let’s adapt this to Bitcoin.
Once Bitcoin’s ecosystem is seeded a crystallization process begins. Growth becomes exponential and self-reinforcing. In this model, the tipping point (green circle) represents a dramatic change at which point many people and oganizations adopt Bitcoin.
Equilibration precedes nucleation and contains non specific aggregates (i.e. unorganized clusters). In Bitcoin we can think of this as the time shortly after Satoshi Nakamoto introduced Bitcoin to the world and awareness of his construct slowly diffused into key technical and social circles. During this period we see mostly social discovery and early mining efforts. Though it had essentially 0 external value, energy was added to the system in the form of computational work. At some point during equilibration measurable value was created. Perhaps the catalytic seed was the first Bitcoin purchase. Laszlo Hanyecz externalized Bitcoin’s value and by doing so transformed it from a store of value (as measured by work/energy) to a medium of exchange. On May 22, 2010 he bought 2 pizzas for 10,000 Bitcoins.
Nucleation is a high energy barrier. And we can see why. In order for Bitcoin to “crystallize” many different key ingredients are needed. Clusters of Bitcoin activity must reach critical size such that benefit of growth outweighs the cost. These take the form of wallets, exchanges, nodes, mining pools, more engineering talent etc. Silk Road and Mt. Gox are examples of the ecosystem’s aggregate order during early nucleation.
As nucleation progresses we begin to see cross links between these various aggregates or nodes of activity: network security improves, hashrate climbs, more coins are mined and sold, exchanges provide custodial arrangements, fiat to Bitcoin onramps grow, meetups and conferences draw outside interest, and there are a few real world Bitcoin only transactions. These are early signs of lattice formation. Like a growing crystal each connection adds an order of magnitude strength to the ecosystem.
Crystallization is the most “visible” phase — price is climbing and Bitcoin transactions are becoming more common. Nucleation has primed Bitcoin for rapid growth. It ascends up the S-curve entering the fastest portion of the adoption phase. During this time Bitcoin will seem to be an organic, self-driving and organizing process much like a growing crystal. As aggregates join they reduce their energy state and become more stable. The energetic benefit of joining the crystal lattice outweighs the cost. We will see a similar phenomenon in hyperbitcoinization —
Rejecting Bitcoin will cost more than adopting it.
After the tipping point Bitcoin nucleation will continue albeit at a slower rate. Yet these tail events are also critical for Bitcoin’s success and include wide spread systemic institutional and government adoption. Without these key players Bitcoin may fail to reach saturation and price stability, doomed to unacceptable levels of volatility.
The hyperbitcoinization graph limited to price events. Although depicted as distinct segments, each phase will overlap. For example, we see medium of exchange events well before the tipping point.
The path to hyperbitcoinization is described by the red S-curve which represents Bitcoin’s price (or market value). During nucleation Bitcoin begins to experience a series of microbubbles. Each of these reflects a fundamental shift induced by underlying events. Sophisticated retail investors are joined by early public risk takers. Institutional investors join the fray. VC funded businesses are built around Bitcoin’s core concepts. Wall St. firms devise instruments to monetize Bitcoin. Public corporations adopt it for payments. And so on.
Larger price bubbles and continued volatility follow these discovery phases. During this time Bitcoin use cases, improved fiat to Bitcoin onramps coupled to early institutional and select banking acceptance become important drivers. Price rapidly climbs, nearly unabated.
Beyond the tipping point Bitcoin’s rate of appreciation itself becomes exponential. It begins to supplant fiat taking on characteristics of money beginning with store of value, followed by medium of exchange, and finally unit of account at the plateau of the S-curve. At the plateau price volatility is minimal and hyperbitcoinization has been achieved.

As of this writing I believe Bitcoin is in the mid to late nucleation phase. The current bubble cycles are “microbubbles” on this scale. As we’ll see in the next sections, $10K 200 day moving average is not even a rounding error in the world of hyperbitcoinization.
In 2018 Bitcoin is still under the peak nucleation graph building its infrastructure.

Global Valuation of Money

Social acceptance, resulting demand coupled to Bitcoin’s technology are driving growth at network speeds. Fundamental, beneficial sound monetary properties give Bitcoin the opportunity to become the world’s first universal digital currency:
  • No border control — Bitcoin unwinds nationalistic/feudal monetary systems that trap local populations into using government decreed currencies. It is a digital currency that can achieve global consensus.
  • No centralized authority — Bitcoin has inherent property rights & security. No central agency can confiscate your coins nor prevent you from transacting with Bitcoin.
  • No inflationary policy — Government agencies cannot artificially deflate Bitcoin’s value via conventional currency machinations. Price is determined by the market. Money supply is based on computational work and math.
Bitcoin’s recent ATH market capitalization reached $326B on Dec 17, 2017. Although a phenomenal achievement for nascent technology, if Bitcoin aims to displace fiat it has a long way to go.
What does Bitcoin need to do? How much value must it absorb? Trace Mayer endows Bitcoin with infinite expansive capacity.
By analogy, these institutional products [futures, ETFs] are like connecting a major metropolis’s water system (US$90.4T and US$2 quadrillion) via a nanoscopic shunt to a tiny blueberry ($150B) that is infinitely expandable. — Trace Mayer, November 2017
If Bitcoin becomes the only unit of account, medium of exchange and store of value it will need to absorb a global glut of value.
This is what we have today —
  • $7.7T of gold
  • $73T value in global stock markets
  • $127T in money (coins, notes, checking, savings)
  • $215T in debt (and growing)
  • $217T global real estate
  • $1.2Q+ in derivatives
  • and more
(Q = quadrillion = 1,000,000,000,000,000)
Though not an exhaustive list, it gives us a general idea of the scale and scope of the market. This accounting will include derivatives and similar instruments though they may be significantly altered, scaled back or perhaps even entirely eliminated in an ideal implementation of hyperbitcoinization.
In order to supplant fiat, Bitcoin must be at least equivalent value and play every part in our traditional currency system and satisfy money’s various roles. Hyperbitcoinization requires complete and total domination over every corner of the financial world. Bitcoin should be able to buy coffee and power the global economy.
In hyperbitcoinization, Bitcoin needs to be all money.

Bitcoin Valuation

Bitcoin proponents talk about “abandoning” the use of “Bitcoin” as a commonly used unit of denomination. They reason as Bitcoin becomes a global currency its astronomical value will not be feasible for everyday transactions. Like any good form of money Bitcoin is divisible. In fact, by up to 100,000,000 satoshis. The satoshi will act as our base accounting unit. You will buy goods and services and be paid in satoshis.
Let’s see if this is plausible.
There will be nearly 21 million coins once the last Bitcoin block is mined. It’s estimated 20% of current mined Bitcoins are forever lost. If this loss rate holds then the total accessible will be at most 16.8 million. The list of global value of all money totals about $1.8Q.
Some basic math:
Global value of all money= $1.8Q.
Divide by 16.8 million Bitcoins = $107,142,857
Round result = $100,000,000/Bitcoin
Next step:
100,000,000 satoshis per Bitcoin
$100,000,000/Bitcoin ÷ 100,000,000 satoshis per Bitcoin
= $1 per satoshi
Each Bitcoin is $100,000,000 and each satoshi accounts for $1 of value in the age of hyperbitcoinization. Of course, this may be more or less depending on the actual total value that Bitcoin subsumes. And we have not accounted for changes in how we may value assets and Bitcoin’s future impact on practices such as fractional reserve banking. For this exercise I will defer discussion as much of this has yet to be determined.
Let’s put this in perspective with today’s prices.
Current 200 DMA = $10,000/Bitcoin
Hyperbitcoin price = $100,000,000/Bitcoin
Current % of future value = 0.01%
Bitcoin’s current price is a fraction of its potential should hyperbitcoinization become a reality. Even if we reduce the scope of Bitcoin’s market an order of magnitude to $10,000,000/Bitcoin (a Fundstrat price estimate) we are still in the 0.1% of future value range.
Does price trajectory support the immense increase in value?

Bitcoin Price Trend

Bitcoin’s price will not go up forever as at some point all economic value will be accounted for. First let’s determine when price reaches $100,000,000 per Bitcoin. I will use a model introduced in one of my earlier articles. It uses “top of the bubbles” and a non-linear regression curves to form a channel. We’ll use this as our guide.
The orange line is a non-linear regression curve. The green curve is a trend line formed by the top of Bitcoin’s earlier bubbles. The recent price spike was a “minor” bubble and did not reach the top of the bubble curve.
The channel narrows as price approaches the $100,000,000 mark in 2030. I suspect Bitcoin’s price will oscillate within and around these boundaries, increasingly constrained as it approaches hyperbitcoinization.
Based on these curves the theoretical limit for Bitcoin’s price is just north of $500,000,000 where our two curves meet. But as discussed above, innovative technologies eventually reach saturation and we should expect Bitcoin to behave similarly. There will be a plateau in value. Using the above trend let’s build a graph incorporating Everett’s S-curve of adoption.
Hypothetical S-Curve for hyperbitcoinization. As of June 2018 $10K 200 DMA to $100M per Bitcoin. The graph is not intended to depict or predict prices along the path to the plateau.
Of course as we learned above, adoption will not follow a textbook S-curve. But this linear price chart shows Bitcoin has not even begun its ascent. Bitcoin’s price is still within horizontal part of the curve. Even if we adjust our final price by an order or two magnitude today’s price is on the flat part of the curve before the tipping point.
Hypothetical S-Curve for hyperbitcoinization (lite). As of June 2018, $10K 200 DMA to $10M per Bitcoin. Hyperbitcoinization occurs about 3 years or so ealier than the $100M model. The graph is not intended to depict or predict prices along the path to the plateau.
Bitcoin’s path to peak price will more likely be composed of successive smaller overlapping S-curves and we can surmise that it won’t plateau exactly as shown. Moreover at these scales minor changes of the curves delimiting the path to hyperbitcoinization will result in valuation changes on the order of millions of dollars and could push price stability out several years.
Nevertheless we have a range of $10M to $100M (fractional percentages of current price) that may be achieved within a 20 year span.
Twenty years may not seem like enough time but as Parabolic Trav and Prateek Goorha stated:
“Bitcoin is network money for a network economy”
Exponential rates of growth are difficult to comprehend due to our propensity to forecast the future using linear time frames. Yet in a short time computers and the internet have become integral parts of our lives and key economic drivers. The current long term price trend and continued exponential growth support Bitcoin’s case to supplant present value carried by all money in the world.

Hyperbitcoinization

Bitcoin Pragmatists may counter that Bitcoin — as money — will become part of a mosaic of digital and “paper” currencies (most paper currencies are just computer ledger entries). In certain locales and businesses it may become the dominant currency, will satisfy limited (but valuable) use cases such as remittances, wealth transfer, off shore banking and interbank settlement. It may evolve to power a token economy but will not entirely supplant fiat.
The pragmatist’s view leaves room for fiat which opens the path to Bitcoin fractional reserve banking, deepening government decree and resulting monetary shenanigans.
Bitcoin Maximalists will argue this is a missed opportunity.
I don’t believe we shall ever have a good money again before we take the thing out of the hands of government, that is, we can’t take it violently out of the hands of government, all we can do is by some sly roundabout way introduce something that they can’t stop — Friedrich Hayek, 1984 (video here)
Centrally controlled money supply begets a centrally planned economy. With money out of the hands of controlling entities we have a chance to return to a sound monetary policy and stop gifting enormous debt to future generations.
Maximalists would be ecstatic to see Bitcoin achieve manifest destiny and complete the journey to hyperbitcoinization. The end of the fiat economy would herald a new economic paradigm espoused in part by Austrian free market economists. Money would no longer be controlled by the whims of central banks.
  • No more fractional reserve banking.
  • No more government induced boom and bust cycles with quantitative easing, bail-ins, and runaway inflation.
  • No more forced high time preference (immediate gratification).
  • Eradication of government abuse and confiscation of money through inflationary policies.
The global economy would be bound by an immutable, decentralized, verifiable and consensus powered form of digital money. One sound standard through which all business is transacted. Bitcoin becomes the dominant currency by social decree. Although social decree is voluntary, as more people agree to place value in Bitcoin network effects transform it into an indestructbile and unavoidable form of communicating value.
With Bitcoin you own your money. Personal ownership of money may thoroughly transform our modern world. We will go from a centralized economy manipulated by the few to one based on sound money principles — protecting the present, preserving the past and preparing for the future. Education, agriculture, medicine, and industry will be radically transformed once short sighted policies which benefit the few are abandoned for those with longer time horizons providing greater and lasting benefits for everyone. Incessant government machinations devaluing our money, work and lives will come to an end.
Hyperbitcoinization is not necessarily a fantasy. 20 years ago we could not imagine how the internet would impact our world. Bitcoin will not be a panacea for all of our ills but I am fairly sure it will drive a monumental shift in our relationship with money and reframe our roles as citizens as part of a borderless global economy.

Follow me here on Medium and Twitter.
______________________
Bitcoin has seen unprecedented price appreciation against a background of volatility. This is not investment advice. Perform your own due diligence.

BlackRock has big influence in the Bitcoin ecosystem, but who owns BlackRock?

BlackRock has big influence in the Bitcoin ecosystem. For example with the development of the Bitcoin ETF (IBIT) and investments within the ...