Satoshi Nakamoto published the bitcoin white paper 31/Oct 2008 [1], created the bitcoin genesis block 03/Jan 2009, and released the bitcoin code 08/Jan 2009. So begins a journey that leads to a $70bn bitcoin (BTC) market today.
Bitcoin is the first scarce digital object the world has ever seen. It is scarce like silver & gold, and can be send over the internet, radio, satellite etc.
" As a thought experiment, imagine there was a base metal as scarce as gold but with the following properties: boring grey in colour, not a good conductor of electricity, not particularly strong [..], not useful for any practical or ornamental purpose .. and one special, magical property: can be transported over a communications channel" — Nakamoto [2]
Surely this digital scarcity has value. But how much? In this article I quantify scarcity using stock-to-flow, and use stock-to-flow to model bitcoin’s value.
Scarcity and Stock-to-Flow
Dictionaries usually define scarcity as 'a situation in which something is not easy to find or get', and 'a lack of something'.
Nick Szabo has a more useful definition of scarcity: 'unforgeable costliness'.
"What do antiques, time, and gold have in common? They are costly, due either to their original cost or the improbability of their history, and it is difficult to spoof this costliness. [..] There are some problems involved with implementing unforgeable costliness on a computer. If such problems can be overcome, we can achieve bit gold." — Szabo [3]
"Precious metals and collectibles have an unforgeable scarcity due to the costliness of their creation. This once provided money the value of which was largely independent of any trusted third party. [..][but] you can’t pay online with metal. Thus, it would be very nice if there were a protocol whereby unforgeably costly bits could be created online with minimal dependence on trusted third parties, and then securely stored, transferred, and assayed with similar minimal trust. Bit gold." — Szabo [4]
Bitcoin has unforgeable costliness, because it costs a lot of electricity to produce new bitcoins. Producing bitcoins cannot be easily faked. Note that this is different for fiat money and also for altcoins that have no supply cap, have no proof-of-work (PoW), have low hashrate, or have a small group of people or companies that can easily influence supply etc.
Saifedean Ammous talks about scarcity in terms of stock-to-flow (SF) ratio. He explains why gold and bitcoin are different from consumable commodities like copper, zinc, nickel, brass, oil, because they have high SF.
"For any consumable commodity [..] doubling of output will dwarf any existing stockpiles, bringing the price crashing down and hurting the holders. For gold, a price spike that causes a doubling of annual production will be insignificant, increasing stockpiles by 3% rather than 1.5%."
"It is this consistently low rate of supply of gold that is the fundamental reason it has maintained its monetary role throughout human history."
"The high stock-to-flow ratio of gold makes it the commodity with the lowest price elasticity of supply."
"The existing stockpiles of Bitcoin in 2017 were around 25 times larger than the new coins produced in 2017. This is still less than half of the ratio for gold, but around the year 2022, Bitcoin's stock-to-flow ratio will overtake that of gold" — Ammous[5]
So, scarcity can be quantified by SF.
SF = stock / flow
Stock is the size of the existing stockpiles or reserves. Flow is the yearly production. Instead of SF, people also use supply growth rate (flow/stock). Note that SF = 1 / supply growth rate.
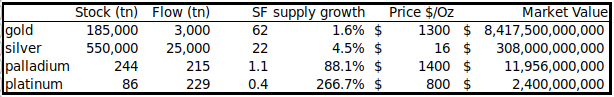
Let’s look at some SF numbers.
Gold has the highest SF 62, it takes 62 years of production to get current gold stock. Silver is second with SF 22. This high SF makes them monetary goods.
Palladium, platinum and all other commodities have SF barely higher than 1. Existing stock is usually equal or lower than yearly production, making production a very important factor. It is almost impossible for commodities to get a higher SF, because as soon as somebody hoards them, price rises, production rises, and price falls again. It is very hard to escape this trap.
Bitcoin currently has a stock of 17.5m coins and supply of 0.7m/yr = SF 25. This places bitcoin in the monetary goods category like silver and gold. Bitcoin's market value at current prices is $70bn.
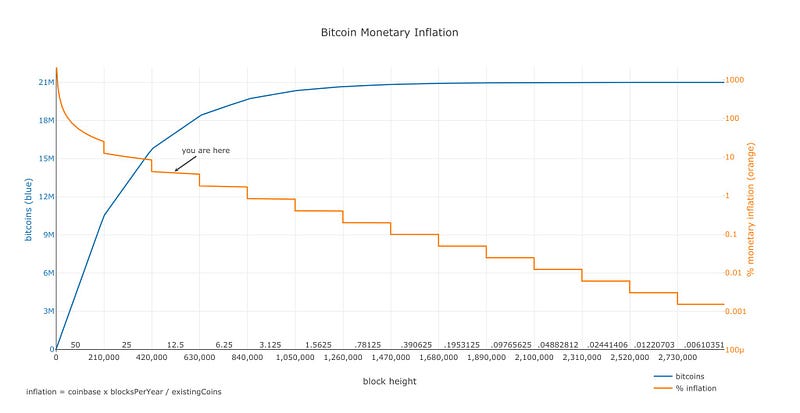
Supply of bitcoin is fixed. New bitcoins are created in every new block. Blocks are created every 10 minutes (on average), when a miner finds the hash that satisfies the PoW required for a valid block. The first transaction in each block, called the coinbase, contains the block reward for the miner that found the block. The block reward consists of the fees that people pay for transactions in that block and the newly created coins (called subsidy). The subsidy started at 50 bitcoins, and is halved every 210,000 blocks (about 4 years). That's why 'halvings' are very important for bitcoins money supply and SF. Halvings also cause the supply growth rate (in bitcoin context usually called 'monetary inflation') to be stepped and not smooth.
source: https://plot.ly/~BashCo/5.embed
Stock-to-Flow and Value
The hypothesis in this study is that scarcity, as measured by SF, directly drives value. A look at the table above confirms that market values tend to be higher when SF is higher. Next step is to collect data and make a statistical model.
Data
I calculated bitcoin's monthly SF and value from Dec 2009 to Mar 2018 (111 data points in total). Number of blocks per month can be directly queried from the bitcoin blockchain with Python/RPC/bitcoind. Actual number of blocks differs quite a bit from the theoretical number, because blocks are not produced exactly every 10 minutes (e.g. in the first year 2009 there were significantly less blocks). With the number of blocks per month and known block subsidy, you can calculate flow and stock. I corrected for lost coins by arbitrarily disregarding the first million coins (7 months) in the SF calculation. More accurate adjusting for lost coins will be a subject for future research.
Bitcoin price data is available from different sources but starts at Jul 2010. I added the first known bitcoin prices (1$ for 1309 BTC Oct 2009, first quote of $0.003 on BitcoinMarket Mar 2010, 2 pizza's worth $41 for 10,000 BTC May 2010) and interpolated. Data archeology will be a subject for future research.
We already have the data points for gold (SF 62, market value $8.5trn) and silver (SF 22, market value $308bn), which I use as a benchmark.
Model
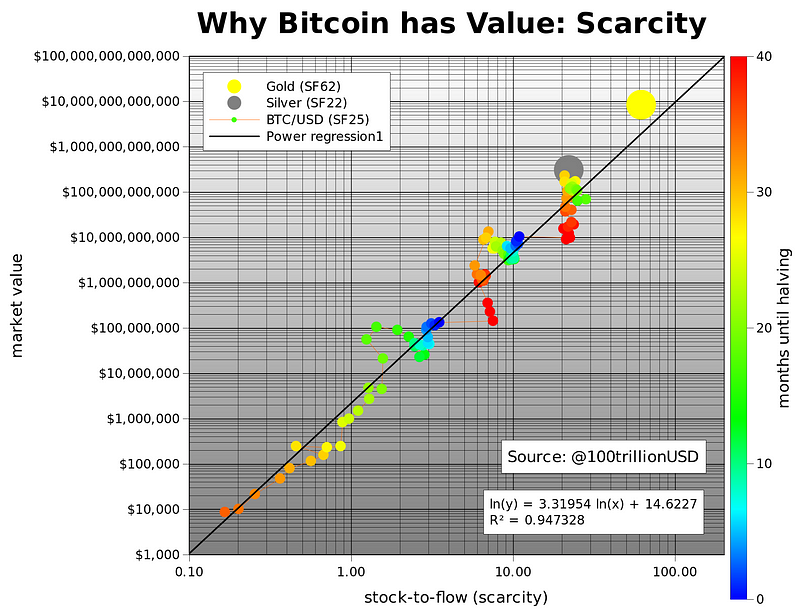
A first scatter plot of SF vs market value shows that it is better to use logarithmic values or axis for market value, because it spans 8 orders of magnitude (from $10,000 to $100bn). Using logarithmic values or axis for SF as well reveals a nice linear relationship between ln(SF) and ln(market value). Note that I use natural logarithm (ln with base e) and not common logarithm (log with base 10), which would yield similar results.
Fitting a linear regression to the data confirms what can be seen with the naked eye: a statistically significant relationship between SF and market value (95% R2, significance of F 2.3E-17, p-Value of slope 2.3E-17). The likelihood that the relationship between SF and market value is caused by chance is close to zero. Of course other factors also impact price, regulation, hacks and other news, that is why R2 is not 100% (and not all dots are on the straight black line). However, the dominant driving factor seems to be scarcity / SF.
Charts made with gnuplot and gnumerics
What is very interesting is that gold and silver, which are totally different markets, are in line with the bitcoin model values for SF. This gives extra confidence in the model. Note that at the peak of the bull market in Dec 2017 bitcoin SF was 22 and bitcoin market value was $230bn, very close to silver.
Because halvings have such a big impact on SF, I put months until the next halving as a color overlay in the chart. Dark blue is the halving month, and red is just after the halving. Next halving is May 2020. Current SF of 25 will double to 50+, very close to gold (SF 62).
The predicted market value for bitcoin after May 2020 halving is $1trn, which translates in a bitcoin price of $55,000. That is quite spectacular. I guess time will tell and we will probably know one or two years after the halving, in 2020 or 2021. A great out of sample test of this hypothesis and model.
People ask me where all the money needed for $1trn bitcoin market value would come from? My answer: silver, gold, countries with negative interest rate (Europe, Japan, US soon), countries with predatory governments (Venezuela, China, Iran, Turkey etc), billionaires and millionaires hedging against quantitative easing (QE), and institutional investors discovering the best performing asset of last 10 yrs.
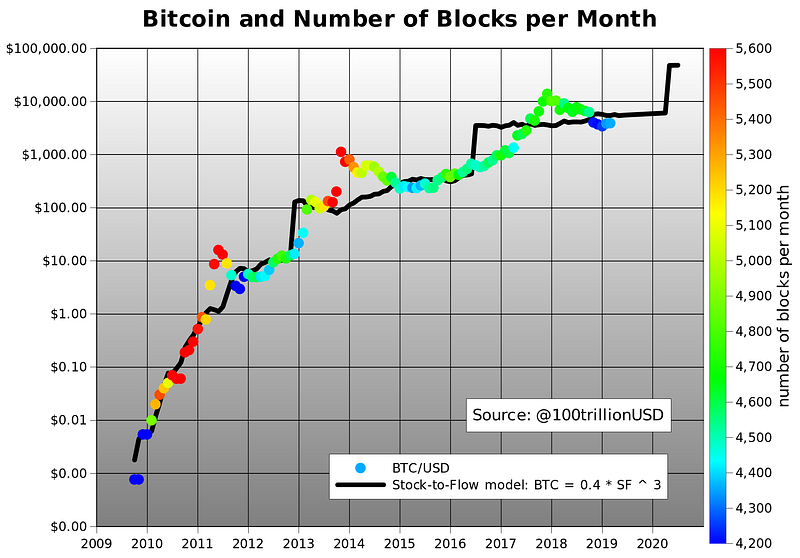
We can also model bitcoin price directly with SF. The formula of course has different parameters, but the result is the same, 95% R2 and a predicted bitcoin price of $55,000 after May 2020 halving. I plotted bitcoin model price based on SF (black) and actual bitcoin price over time, with the number of blocks as color overlay.
Charts made with gnuplot and gnumericsvery close
Notice the goodness of fit, especially the almost immediate price adjustment after Nov 2012 halving. Adjustment after Jun 2016 halving was much slower, possibly due to Ethereum competition and the DAO hack. Also, you see less blocks per month (blue) in the first year 2009 and during downward difficulty adjustments end2011, mid2015 and end2018. Introduction of GPU miners in 2010-2011 and ASIC miners in 2013 resulted in more blocks per month (red).
Power Laws and Fractals
Also very interesting is that there is indication of a power law relationship.
The linear regression function: ln(market value) = 3.3 * ln(SF)+14.6
.. can be written as a power law function: market value = exp(14.6) * SF ^ 3.3
Power laws are scarce, you don’t find them very often. The possibility of a power law with 95% R2 over 8 orders of magnitude, ads confidence that the main driver of bitcoin value is correctly captured with SF.
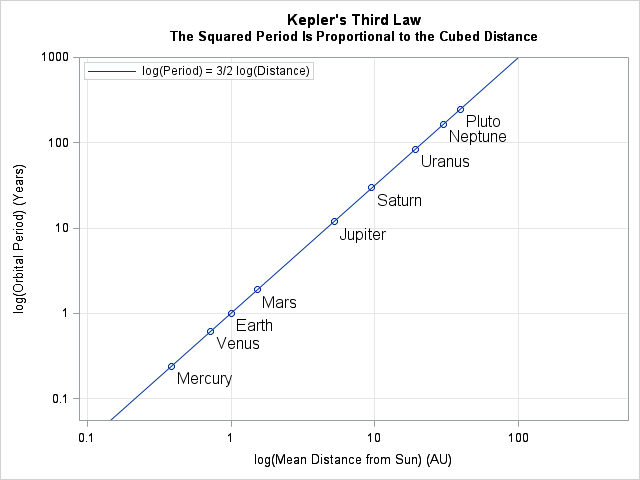
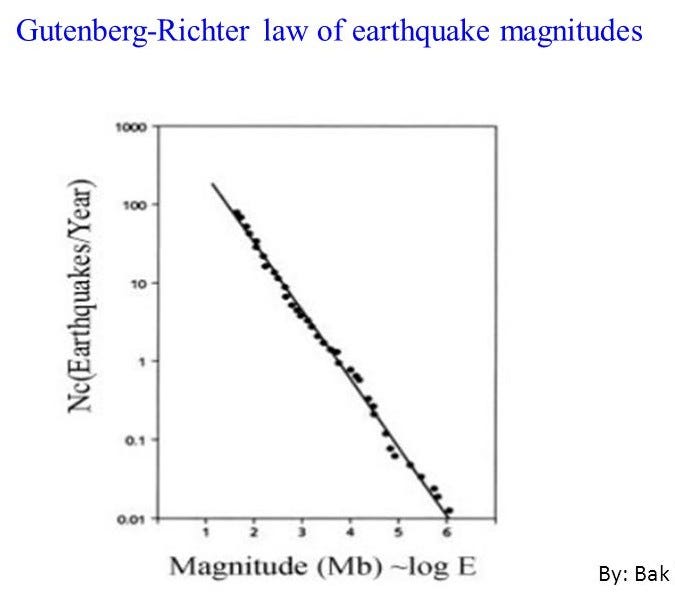
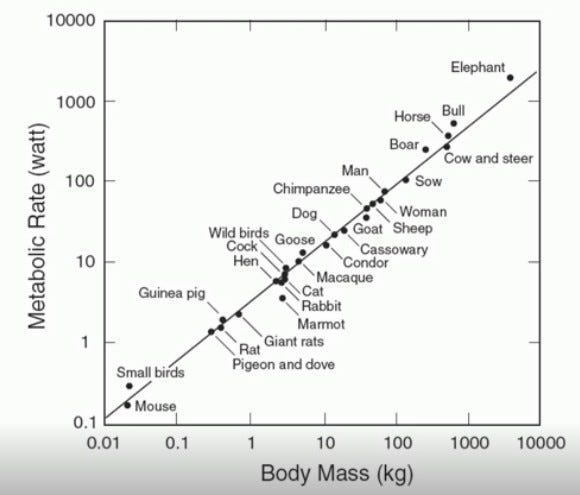
A power law is a relationship in which a relative change in one quantity gives rise to a proportional relative change in the other quantity, independent of the initial size of those quantities. [6]. See appendix for some famous power law examples.
Power laws are interesting because they reveal an underlying regularity in the properties of seemingly random complex systems. Complex systems usually have properties where changes between phenomena at different scales are independent of the scales we are looking at. The picture we take at one scale is therefore similar in some way to the picture we take at another scale. This self-similar property underlies power law relationships . We see this in Bitcoin too: 2011, 2014 and 2018 crashes look very similar (all have -80% dips) but on totally different scales (resp. $10, $1000, $10,000), if you don't use log scales, you will not see it. Scale in-variance and self-similarity has a link with fractals. In fact, parameter a in the power law function above is the 'fractal dimension'. For more information on fractals see the famous study of length of coastlines [7]. Power laws and fractals in bitcoin will be a subject for future research.
Conclusion
Bitcoin is the first scarce digital object the world has ever seen, it is scarce like silver & gold, and can be send over the internet, radio, satellite etc.
Surely this digital scarcity has value. But how much? In this article I quantify scarcity using stock-to-flow, and use stock-to-flow to model bitcoin’s value.
A statistically significant relationship between stock-to-flow and market value exists. The likelihood that the relationship between stock-to-flow and market value is caused by chance is close to zero.
Adding confidence in the model:
Gold and silver, which are totally different markets, are in line with the bitcoin model values for SF.
There is indication of a power law relationship.
The model predicts a bitcoin market value of $1trn after next halving in May 2020, which translates in a bitcoin price of $55,000.