Hello and Welcome,
This is the first issue of the Bitcoin Investing Quarterly Newsletter & Report.
This issue is a look back at 2021 to set the stage for this current year 2022 and beyond.
Contents
- Introduction
- 2021 Macro Summary
- 2021 Bitcoin Results
- Graph Visualisation for Investing In & Out (DCA) USD and GBP
- High, Low and Median tables
- Experiment for Best Day, Week Number and Time to Buy/Sell Bitcoin
- Recommended Publically Available Graphs, Statistics & Metrics for Bitcoin
- Selected Products and Services
- Google Trends
- Halving Countdown
- Selected Important News from 2021
- Conclusion
Introduction
The focus for this newsletter is long term investing, so our view looks on a monthly and yearly basis. “Buy Bitcoin, you’ll thank yourself in the future”.
This newsletter is a compilation of notes, research and analysis that I use for my own Bitcoin investing. Rather than keeping this closed and only for me, my thought has been to open this up for subscribers. For the time taken for the research that is where the subscription fee comes in. Hopefully you’ll find this newsletter useful and or valuable and will subscribe as a paying member.
This newsletter is for simple decision making, based on your own strategy and goals that you define for holding or selling Bitcoin. This newsletter is not about exotic investing such as margin trading, shorting, futures, options or other derivatives. Just simple spot buying and selling of Bitcoin, nothing fancy. An alternative name for the newsletter could be: “The HODL report with a bit of Buying and Selling of Bitcoin”.
In this newsletter the main fiat currency used will be the US dollar (USD) and British Pound Sterling (GBP). However, in subsequent newsletter issues the Euro (EUR) and or Japanese Yen (JPY) may be used if I am able to and also if there is any interest. Incidentally, I’ve always thought measuring Bitcoin in price of Gold per kilo would be a more accurate measure of the true value of Bitcoin, rather than in fiat currency.
2021 Macro Summary
2021 was a year that remained in COVID 19 limbo. This resulted in issues such as:
- Supply chain fragility e.g. Ever Given tanker that was stuck in the Suez Canal
- Semiconductor shortages
- All time high stock markets
- Discussion of reducing quantitative easing by central banks
- Discussion of increasing interest rates
- Russia and Ukraine potential conflict (as of writing, this is now a hot war)
- Geopolitical tensions including China, Taiwan, USA
All the above factors play into the narrative of geopolitical, economic and financial uncertainty in the World.
This is an environment that Bitcoin was either created for, or has naturally come to embrace. Bitcoin embodies its role as the financial and monetary release valve or black hole of monetary gravity.
This enables Bitcoin to be harnessed by ordinary people to protect their money, capital and wealth.
2021 Bitcoin Results
How did Bitcoin fair in 2021 within the above macro environment?
USD ($) in 2021
- Bitcoin reached a high of $69,000
- Bitcoin reached a low of $27,678
- The spread for the year was $41,322
USD ($) in 2021
GBP (£) in 2021
- Bitcoin reached a high of £51,000
- Bitcoin reached a low of £19,500
- The spread for the year was £31,500
GBP (£) in 2021
Source: Data for above USD and GBP compiled from Coinbase via TradingView. Please note the figures above are accurate compared to the visual graph figures which are approximate.
Graph Visualisations for Investing In & Out:
Graph Dotted Lines Legend :
Note: The following graphs were compiled by BBCD Satoshi using data from Coinbase via TradingView. Please note the figures shown on the graphs are approximate, whereas the figures in tables are accurate.
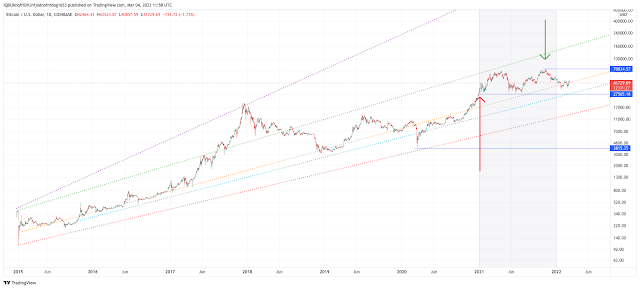
US Dollar (USD)
Logarithmic View of USD: All time
Logarithmic View of USD: 2021

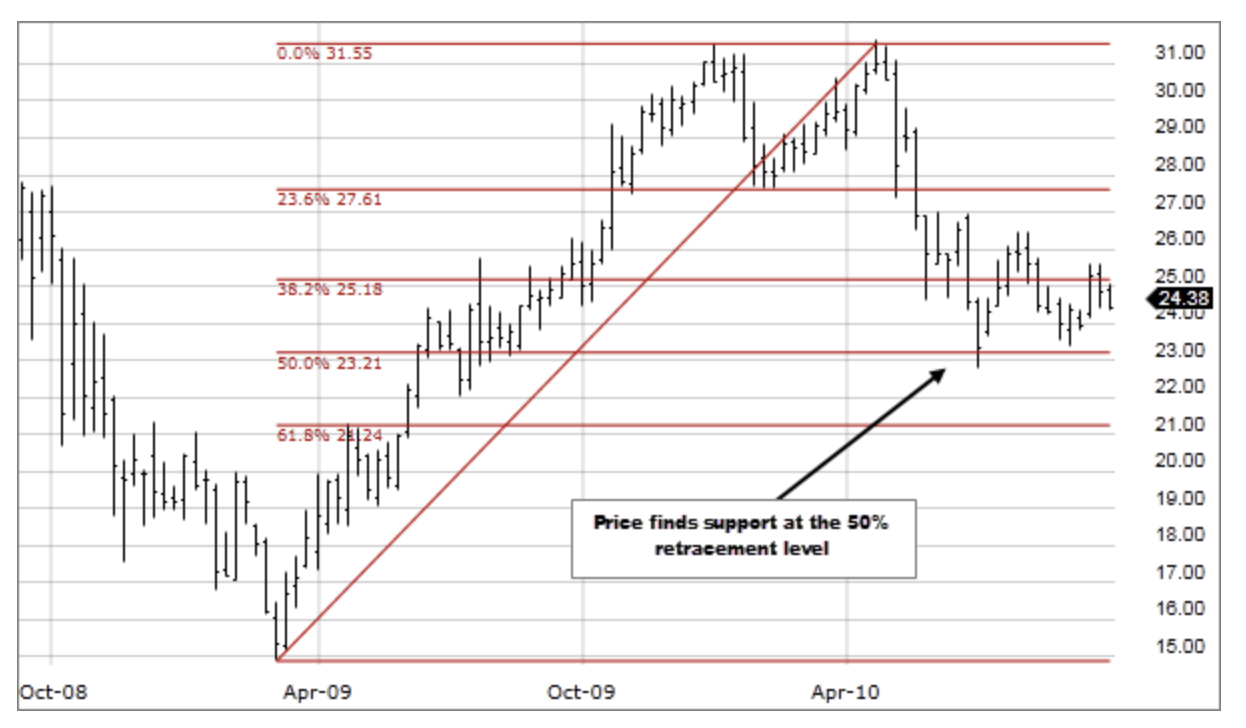
Logarithmic View of USD: Fibonacci Retracement

Logarithmic View of USD: Target for 2030

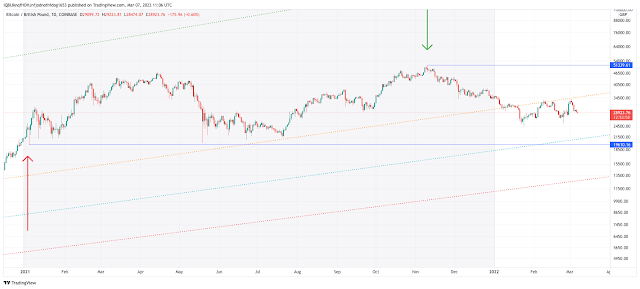
British Pound (GBP)
Logarithmic View of GBP: All time

Logarithmic View of GBP: 2021
Logarithmic View of GBP: Fibonacci Retracement

Logarithmic View of GBP: Target for 2030

USD


GBP


Experiment for Best Day, Week Number and Time to Buy/Sell Bitcoin
This is based on looking at each month in the year to see pattern(s). There can be many factors that cause these patterns.
- One hypothesis could be the salary effect, whereby people paid in Bitcoin are sent their Bitcoin and then cash out into their local currency within a day or two of receiving their salary/wages.
- Another hypothesis can be looking at Dollar Cost Averaging (DCA) into and out of Bitcoin. Algo Trading, Bots and also humans setting a specific day of the week, week number in the month and time in UTC to either buy or sell Bitcoin. As institutions and corporations invest in Bitcoin, the other aspect to consider will be quarters in the year when portfolios are rebalanced.
- I personally think both of these hypotheses will have a bigger impact going forward. Maybe we’ll see the DCA effect clearer
GBP
- I’ve limited this experiment to only GBP.
- This is an experiment currently, but so far has indeed been useful for buying and selling.
- On a rolling basis, only looking at 1 year of data:
- In 2021 the best day, week number to Buy (at lowest point) Bitcoin was on
- last week of the month
- Thursday or Saturday at 4pm or 9pm
- In 2021 the best day, week number to Sell (at highest point) Bitcoin was on
- first week of the month on Monday, Wednesday, Friday or Sunday at 1pm
Data download:
For subscribers please click on the download area for formatted data files. These should be in CSV and Excel format.
Further project for AI and Machine Learning
Over the coming year I’m hoping to make use of machine learning and or artificial intelligence to start making predictions based on previous data. This will enable Bitcoin investors to focus on specific days of the week, week number in a month and quarter for planning ahead to optimise entry and exit for Bitcoin investments. Watch this space.
Publically Available Graphs, Statistics & Metrics for Bitcoin:
These very useful and excellent charts have been created by third parties. Please take your time to become familiar with them if you are not already. I highly recommend subscribing to the authors websites and social media posts.
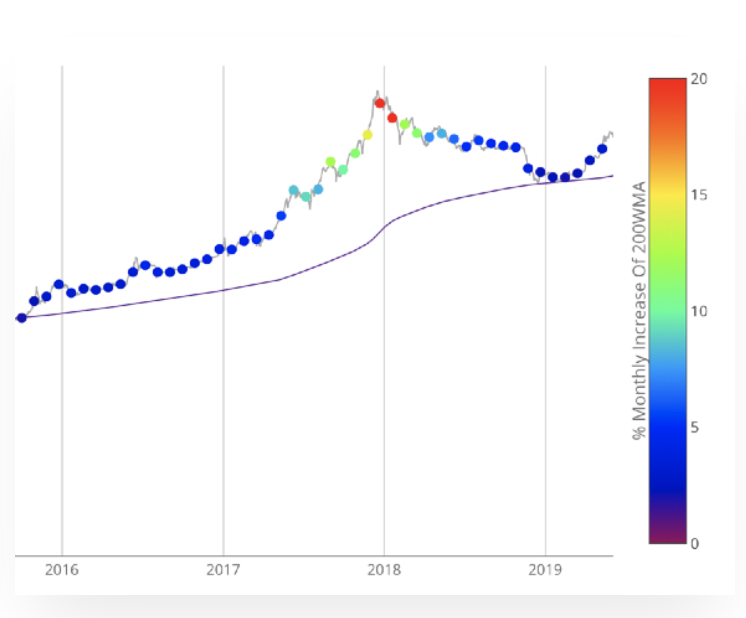
- Puell Multiple
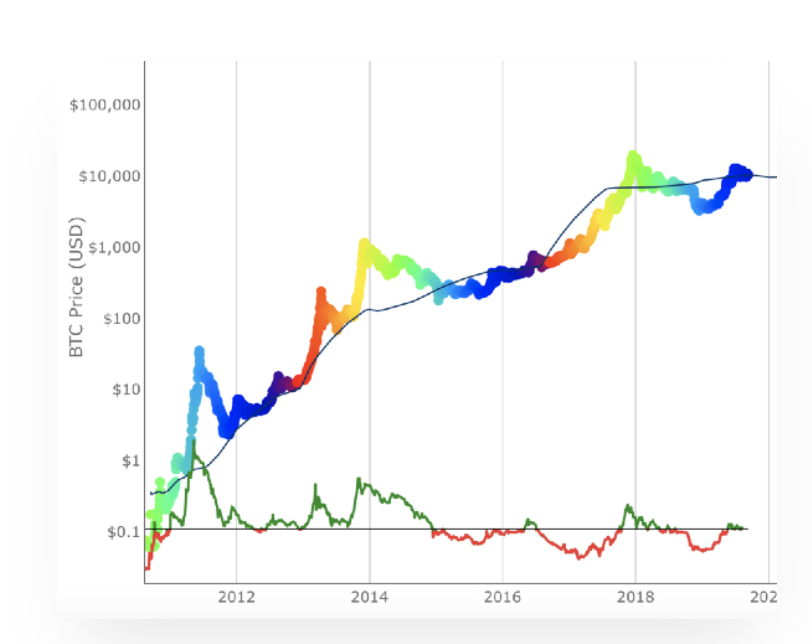
- Stock-to-Flow (S2F)
- Bitcoin Logarithmic Growth Curves/Power Law
Puell Multiple:

Source: https://www.lookintobitcoin.com/charts/puell-multiple/
See also:
https://studio.glassnode.com/metrics?a=BTC&category=&m=indicators.PuellMultiple
https://medium.com/unconfiscatable/the-puell-multiple-bed755cfe358
https://twitter.com/cryptopoiesis
Stock-to-Flow:

Source: https://studio.glassnode.com/metrics?a=BTC&category=&m=indicators.StockToFlowRatio
See also:
https://www.lookintobitcoin.com/charts/stock-to-flow-model/
https://medium.com/@100trillionUSD/modeling-bitcoins-value-with-scarcity-91fa0fc03e25
https://twitter.com/100trillionUSD
Bitcoin Logarithmic Growth Curves:

Source: https://www.lookintobitcoin.com/charts/bitcoin-logarithmic-growth-curve/
See also:
Selected Products and Services:
Casa (https://keys.casa)
Something to seriously consider with Bitcoin is what would happen to your Bitcoin in the event of your death.
Alternatively, how can you securely plan your inheritance with respect to your Bitcoin holdings?
I recommend looking at and considering Casa.
From their website marketing:
“Casa Inheritance keeps your bitcoin safe, even after you pass away. Included with every Casa Diamond membership.”
Kraken OTC (https://www.kraken.com/features/otc-exchange/)
If you are considering making considerable purchases of Bitcoin, I would consider using the OTC (Over The Counter) desk at Kraken.
This would be for purchases over $100,000
I recommend looking at and considering Kraken OTC:
From their website marketing:
“Over-the-counter (OTC) trading takes place off the open Kraken exchange. We offer deeper liquidity and a private, more personalized service to institutions and high net-worth individuals needing to fill large orders that might be too disruptive if placed on open markets at the exchanges. Whether you are trading blocks of $100,000, €10,000,000 or 2,000 Bitcoin, the OTC desk will provide you with execution and settlement services that are discreet, secure and ultra-competitive.”
https://www.kraken.com/features/otc-exchange/
Google Trends:
Searches for the word “Bitcoin”
2021

Last 5 Years

Halving Countdown:
The next Bitcoin halving where the supply is cut in half is likely to be in 2024.
Please see this dashboard for further details (scroll right and left for the full dashboard)
https://bitcoin.clarkmoody.com/dashboard/

Selected Important News from 2021
- TESLA Bought $1.5 Billion in Bitcoin
Source: https://edition.cnn.com/2021/04/28/investing/tesla-bitcoin/index.html
- Coinbase Listed on the Nasdaq with an Initial Public Offering (IPO)
Source: https://www.reuters.com/article/us-coinbase-ipo-idUSKBN2C10K7
- China banned Bitcoin mining
Source: https://www.bbc.com/news/technology-58896545
- Bitcoin upgrade called Taproot
Source: https://www.cnbc.com/2021/11/14/bitcoin-taproot-upgrade-what-it-means-for-investors.html
Conclusion
2021 was marked by the continued COVID 19 Pandemic and associated knock on effect from societal and economical lock downs. I believe the effects of this will be felt for many years to come ranging from inflation and interest rate increases, to disruption and changes for global supply chains.
At the time of writing this (March 2022) Oil has just peaked at $140 USD per barrel. There is discussion that this could become $300 USD per barrel. This can be attributed to the conflict in Ukraine by Russia. The USA is considering banning Russian oil imports. It was not that long ago when oil was negative, during the pandemic. There is open talk of nuclear conflict. How will this impact the price of Bitcoin? Only time will tell.
In terms of USD Bitcoin reached a high of $69,000 and a low of $27,678. The median Bitcoin price was $48,339.00
In terms of GBP Bitcoin reached a high of £51,000 and a low of £19,500. The median Bitcoin price was £35,250.00
2022 and beyond should see increases in the value of Bitcoin when measured against fiat currency. However, the rate of increase is likely to be reduced as Harold Christopher Burger (https://twitter.com/hcburger1) says due to diminishing returns.
In terms of safety and a place to keep capital, this is a 50/50 based on a risk management perspective. If you need access to a portable, secure, non confiscatable asset then Bitcoin is the choice.
The next newsletter will be looking at quarterly one for 2022 (Q1 January, February and March 2022).
A Lot can happen in the world of Bitcoin in 3 x months (1 x quarter), so let's see how Q1 of 2022 does in the next issue.
Thank you for reading.
Any comments or suggestions are welcome at Twitter/bbcdsatoshi
“Buy Bitcoin, you’ll thank yourself in the future”.